- Introduction
- How is compensation amount determined?
- Extra background information on functioning EU ETS & Carbon Leakage legislation
- Remarks / Questions:
Introduction
THREAD on [dis]functioning (Belgian) EU ETS: summary @Apache + own information
“Between 2014 and 2018 a total of +- 197 million euros from the Climate Fund has been paid to companies. In 2019, […] 230 million euros will […] have been distributed” https://t.co/NJWFHAQdAh
“According to policy makers, climate policy therefore gives the EU member states a “competitive disadvantage” compared to non-EU countries and they fear that companies would move to other places. But about which disadvantage do we talk?”
“The EU and Flanders therefore assume that electricity suppliers pass on CO2 costs to their customers, and that energy-intensive companies feel this in their wallets. Therefore, these companies must be compensated for this”
“Ironically, this Climate Fund is financed with the income from the same EU ETS. […] Belgium receives about 2.5% of the total European auction revenues. This Belgian part is further distributed […]. Around 53 % goes to Flanders.” Total distribution: https://t.co/fEVAgRvOKD
“In 2017, the Belgian auction revenues amounted to 143.5 million euros, of which 46.75 million or 33%, went to compensations for energy-intensive industry […] distributed through the […] Hermes Fund, that falls under the authority of minister @philippemuyters (N-VA)”
“Isn’t 33% for subsidies to energy-intensive companies very much? The EU wants Member States from 2020 to aim not to use more than 25% of auction revenues for this type of compensation.”
According to @klimaat_be: “high percentage can be explained by the historically “limited CO2 emissions” of the […] electricity sector. […] Belgium relatively small share […] But: “important energy-intensive industrial cluster, with a relatively high consumption”
How is compensation amount determined?
“calculation method used by the @EU_Commission. Important is that compensations will be reduced in time. Between 2013-2015, 85% of the emission costs were compensated, which will fall to 75% for 2019-2020.”
“electricity consumption is calculated according to the annual CO2 price and an estimated CO2 emission per megawatt hour of electricity: the higher the CO2 price and the energy consumption, the higher the compensation.”
“The @EU_Commission determines the CO2 emissions per MWh for different geographic regions: for Belgium, which belongs to the same energy region as Germany and the Netherlands, it amounts to 0.76 tons per MWh.” @nworbmot
Argument (ex-minister, thanks to @AnunaDe) @JokeSchauvliege: “Therefore the Flemish framework is equal to that of the Netherlands and Germany, which is important for our competitive position”
“@BeterLeefmilieu/@MathiasB9 argues already for years that the estimated CO2 emissions per MWh for Belgium is too high.” […] emissions three to four times lower […]. Therefore, the annual support should also be three to four times lower, […] 10 to 15 million euros suffice”
Argument @philippemuyters: it is about “European regulations that Flanders needs to adapt to.” There is no freedom […] The @EU_Commission is currently looking into an adjustment for the period 2021-2030. Flanders will follow […]. “
“In addition to all the benefits, energy-intensive companies also receive a number of ‘emission rights’ for free. This does not contribute to saving energy “, according to @JohanDanen, who also points to a necessary review of the European emission trading system.”
Extra background information on functioning EU ETS & Carbon Leakage legislation
[based on summary for academic position-paper that I wrote in October 2017 –> https://t.co/tJHjEbsiSM]
[#1] Hypothetical (!) ‘Carbon Leakage’ = “risk” of industry moving away. How is this “risk” calculated?
-
Quantitative: cost (carbon cost: COST) & export / import (trade intensity: HI)
-
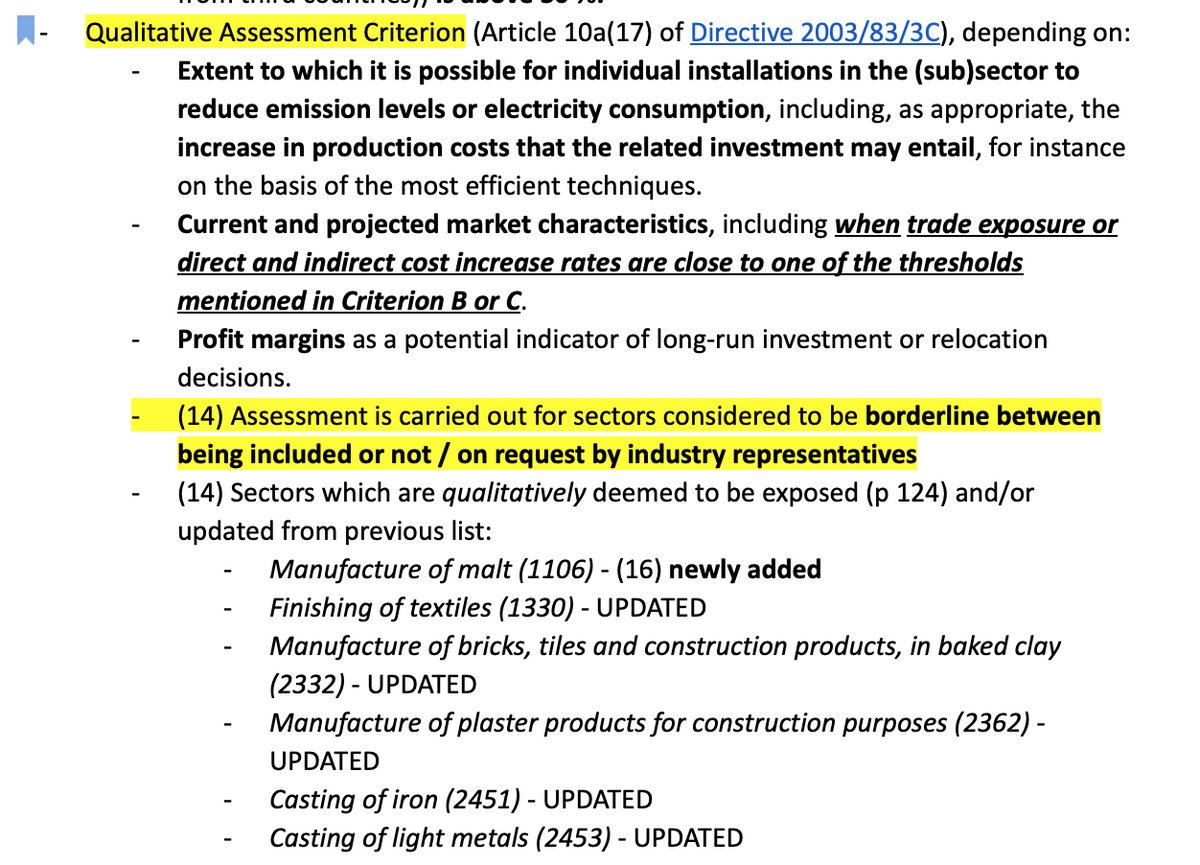
Qualitative: ‘missing data’, ‘sector difficulties’ and projected market mechanisms
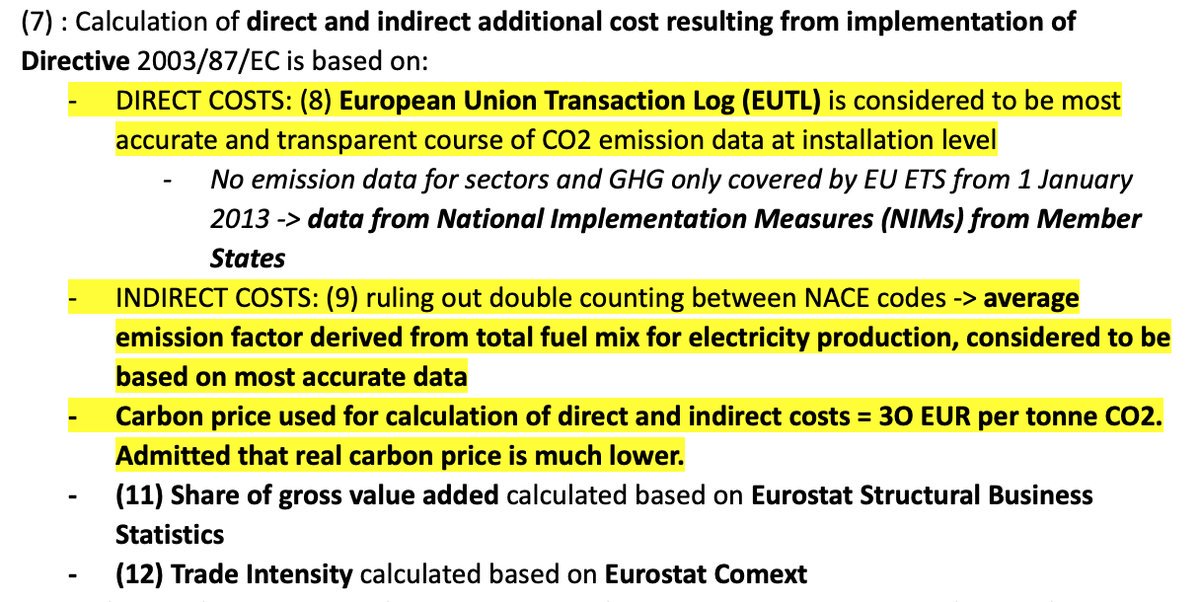
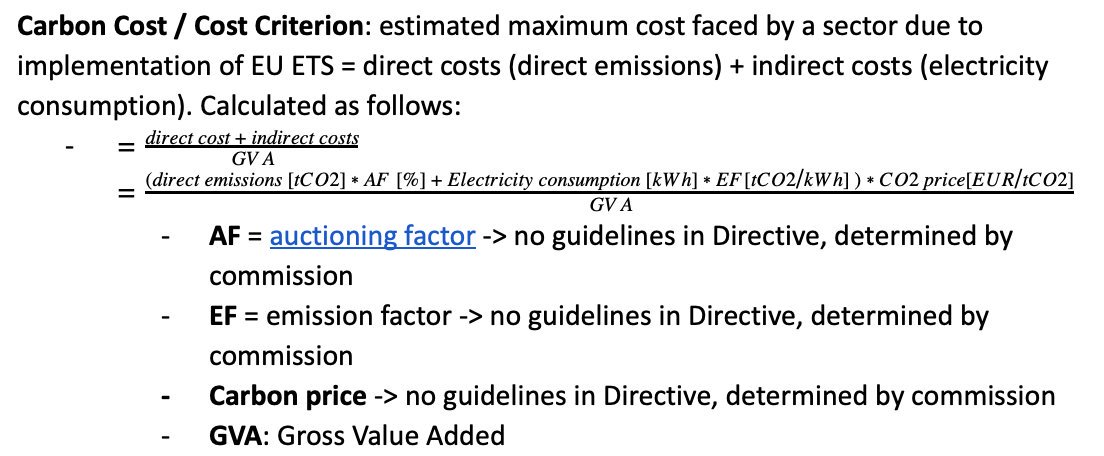
[#2, p 15, 2a] how is COST determined? [2014 Impact study @EU_Commission on ETS Carbon Leakage List https://t.co/J8NaB0oNBL]
- Auctioning Factor: political, free rights
- Emission Factor: technical, CO2 / sector
- Carbon Price: estimated future price
- GVA: Gross Value Added https://t.co/oUCHhLDymx


[#3, p 17, 2a] How is trade intensity (HI) determined? [Impact study @EU_Commission ETS Carbon Leakage List https://t.co/J8NaB0oNBL]
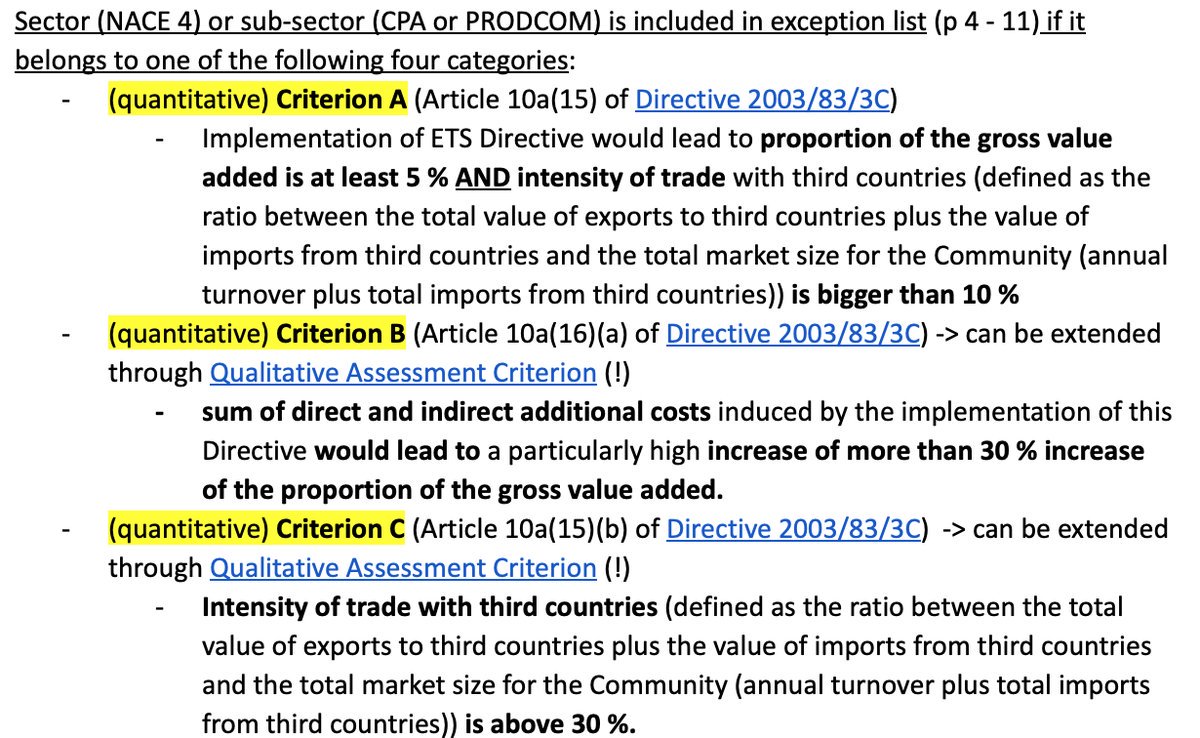
= importance of import and export in relation to domestic market = (import + export) / (turnover + import) with turnover: domestic prod. https://t.co/JpNnHfIH4b

[#4, p 17, 2b] When is a sector included on the list? [ie: free allowances, legislation 2017] If:
! : “subject to evolution of international negotiations”
A: costs> 5% added value + HI> 10% B: costs> 30% added value C: HI> 30% qualitative: # vague rules https://t.co/4L1FYnjhdr


Remarks / Questions:
[1] If the EU grants free allowances at EU level (causing windfall profits: @CarbonMrktWatch + https://t.co/GUYCYqkosU) -> will using EU ETS revenues to “compensate” on National Level provide additional extra profit? See also https://t.co/9cMRP1GJxt
[2] The EU ETS is - like any market system - not ideal. Why not using standards (physical technology-based standards, without monetary market forces), internationally enforced? See also Nature-paper Grischa Perino https://t.co/3m6qyisMCL + @Climat2020
[3] The carbon leakage list seems to be relatively arbitrarily constructed, and might cancel out the intended target. If the member states and regions (including Flanders) also oppose this by giving extra support, the whole scheme is cancelled out.
[4] Much boils down to transparency and participation in EU legislation. ‘Better regulation’ initiative is in the right direction, but is still not picked up enough by NGOs and Academic world:
- 2013: 405 inputs: 92% industry, 3 academic
- 2014: 427 inputs. 89% industry, 3 ac.
[5] EX: Why are there mainly business associations in the ‘EU expert group on climate change policy’ ? Where is the academic community ? [https://t.co/Wbd4dT3MPo ] And why are the meetings and reports closed? Who represents the Member States? https://t.co/kAQkyVrzNs
[6] https://t.co/dagQUKJgxC Currently, new list under discussion @Europarl_EN “The CLL identifies 63 sectors […] covering about 94% of industrial emissions (98% of emissions covered by the CLL 2015-2020)” + At first sight, nothing changed. Maybe @Europarl_EN give it a turn?