- Resource Adequacy: Connecting Existing Methods, Tools, and Metrics with the Future Grid [Michael Milligan, Consultant]
- Changes in Capacity Value for Energy Storage and DR with Increasing VG Levels [Keith Parks, Senior Trading Analyst, Xcel Energy]
- RA Considerations for Renewable Integration in Japan [Kazuhiko Ogimoto, Project Professor, University of Tokyo, Japan]
- Securing RA in a VG World [Matthias Fripp, Associate Professor, University of Hawaii]
- Resource Adequacy and Markets [Rob Gramlich, President, Grid Strategies]
Resource Adequacy: Connecting Existing Methods, Tools, and Metrics with the Future Grid [Michael Milligan, Consultant]
.@EnergySystemsIG webinar started on Evolving Thinking on Resource Adequacy for High VG Scenarios @MatthiasFripp @RobGramlichDC
Background info: https://t.co/ttz8u8CyUB https://t.co/xjcSYhcWaU
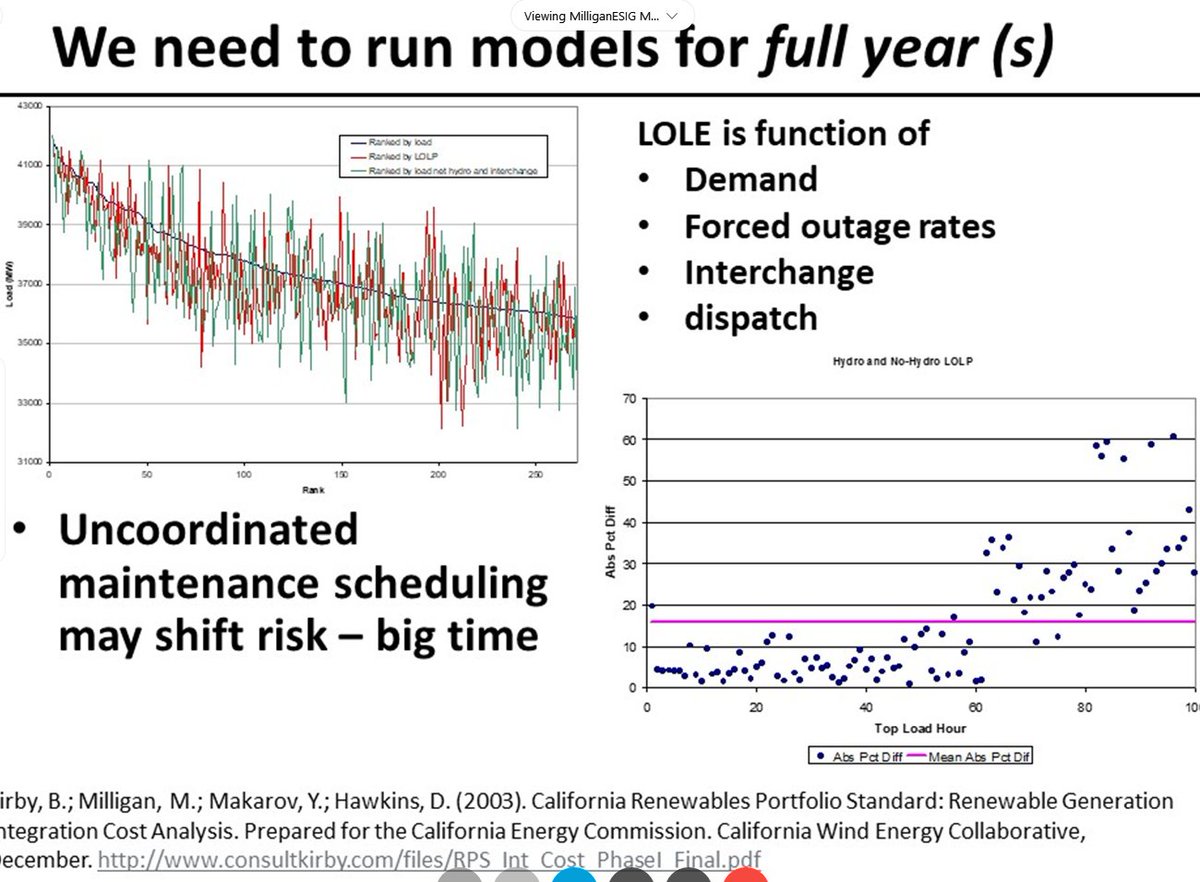
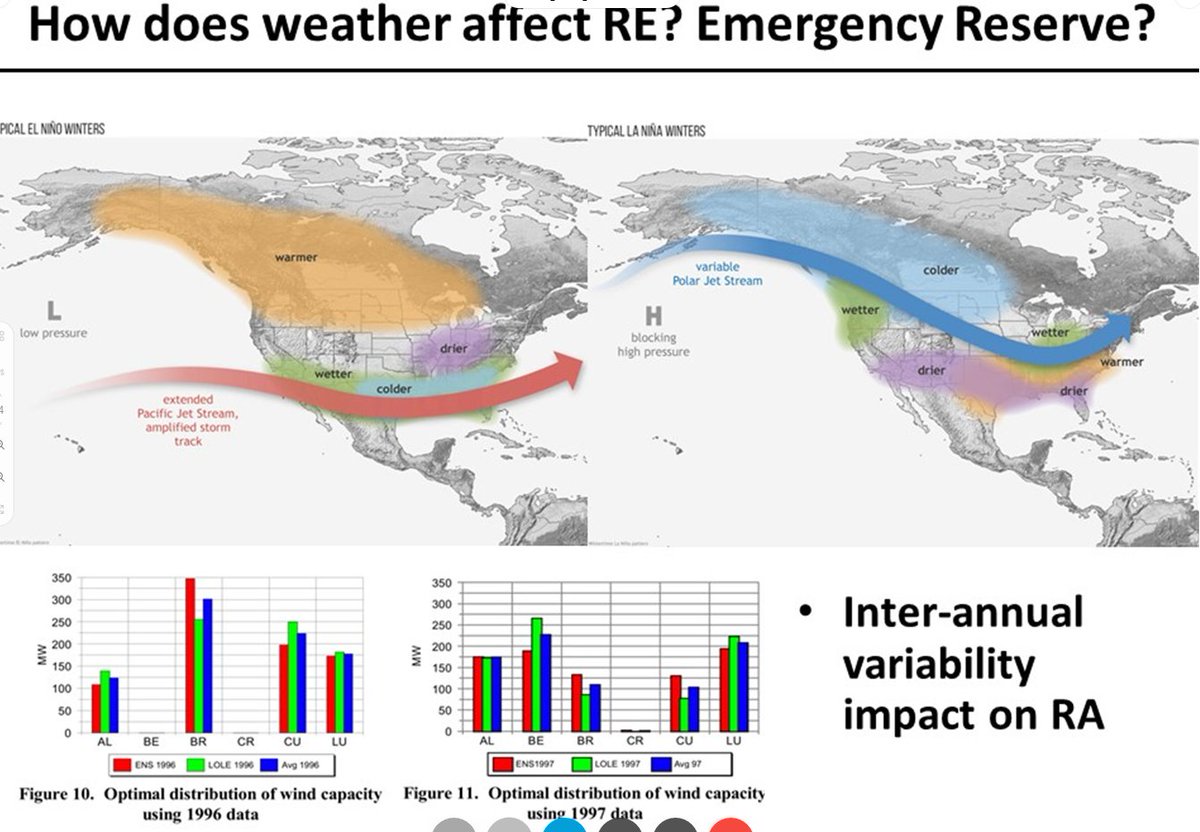
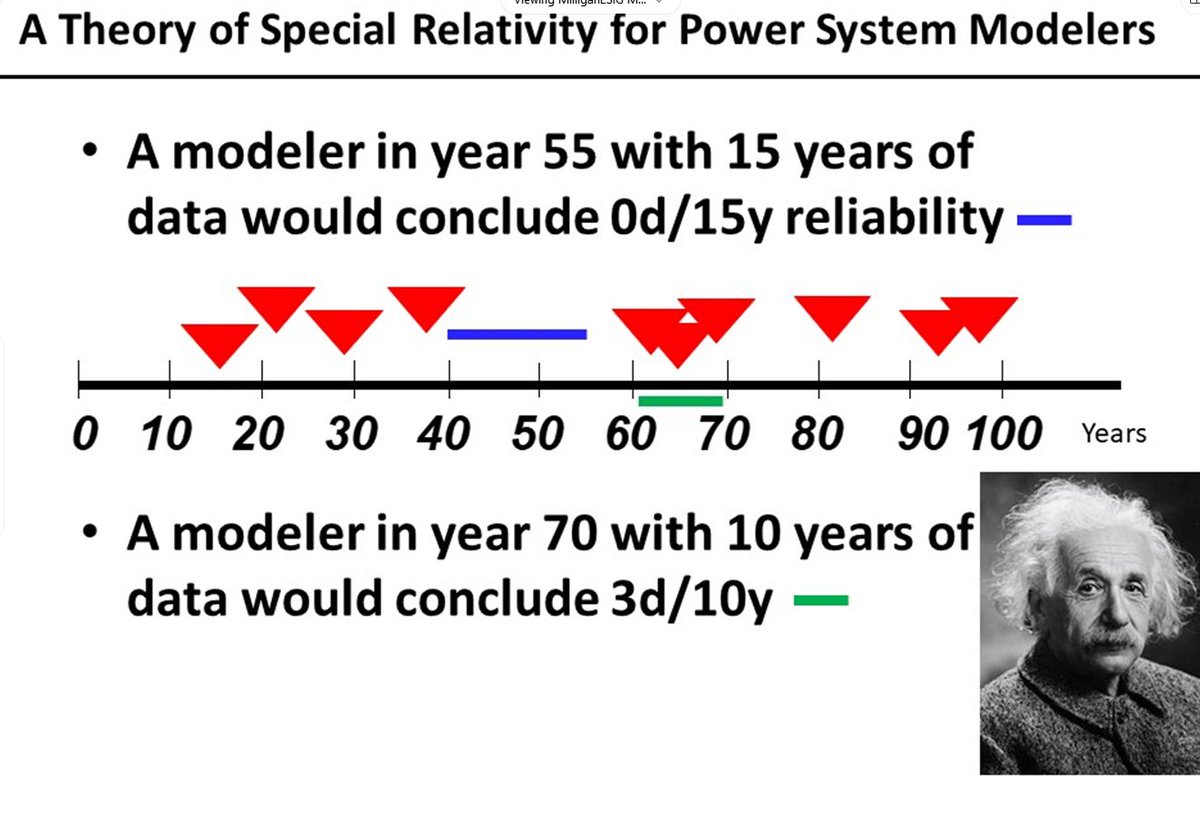
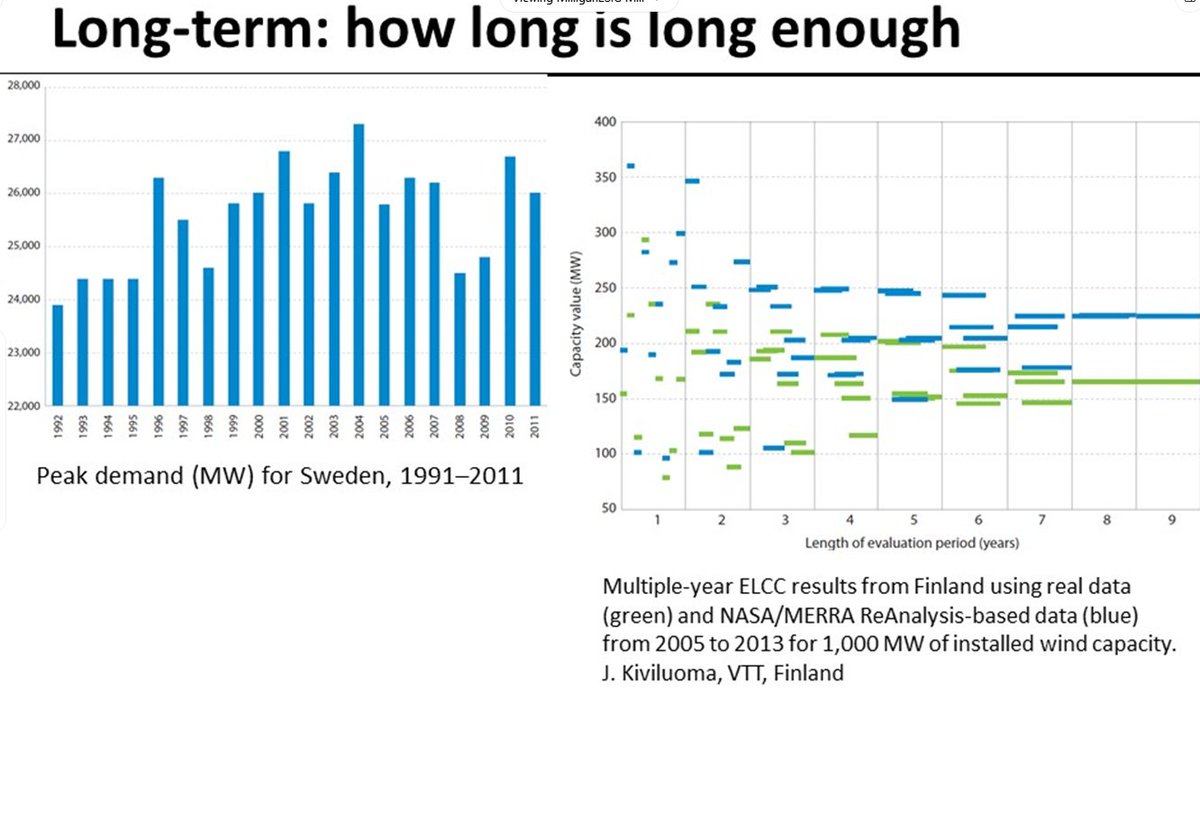
Michael Milligan https://t.co/N8YjNmI0qe starts with discussing terminology (slides omitted) and the importance of using long-term energy (weather) datasets. https://t.co/qZav3eAKA1
How many years do you need to get a reliable picture of the energy system? https://t.co/ttIl71kzyv
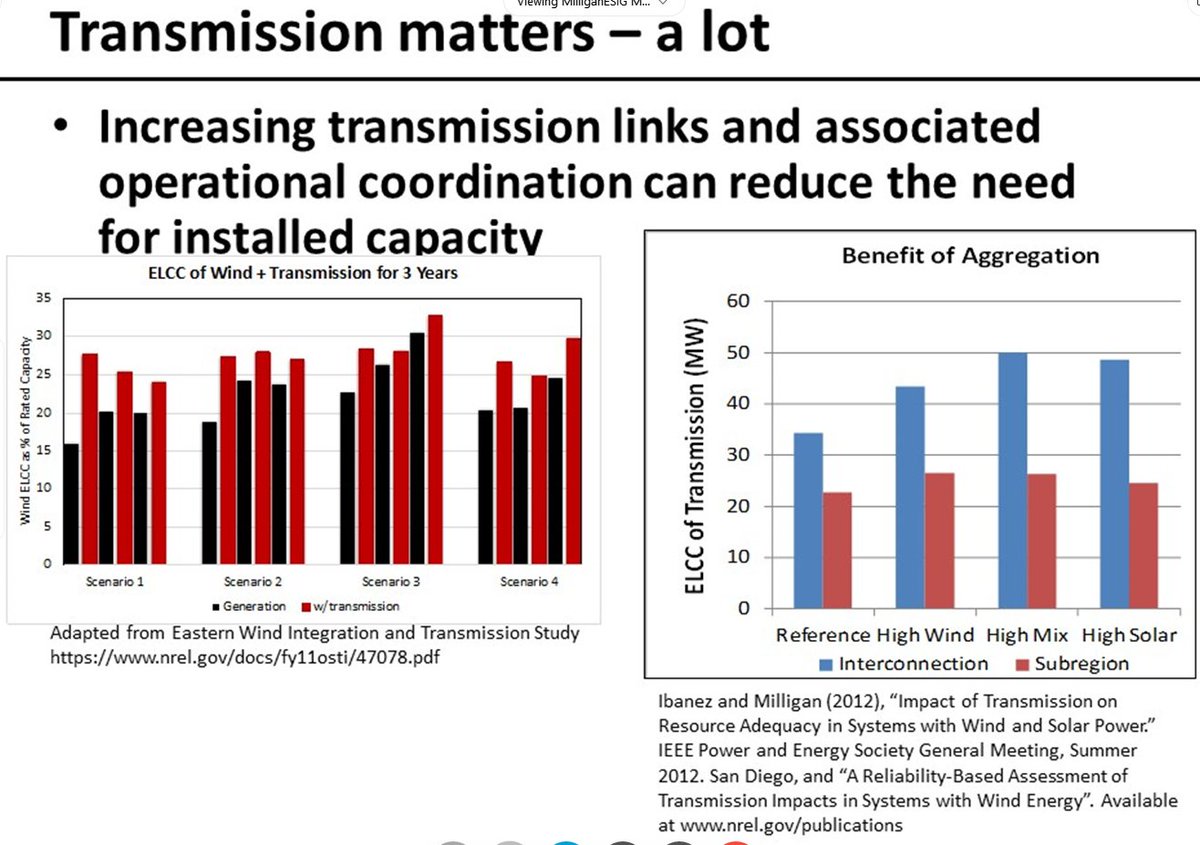
Case study: what would be the need for installed capacity if there is perfect transmission? https://t.co/w31kSQyPri
…and continues on the effects of loss of load events (LOL) https://t.co/UcWTMUABM5
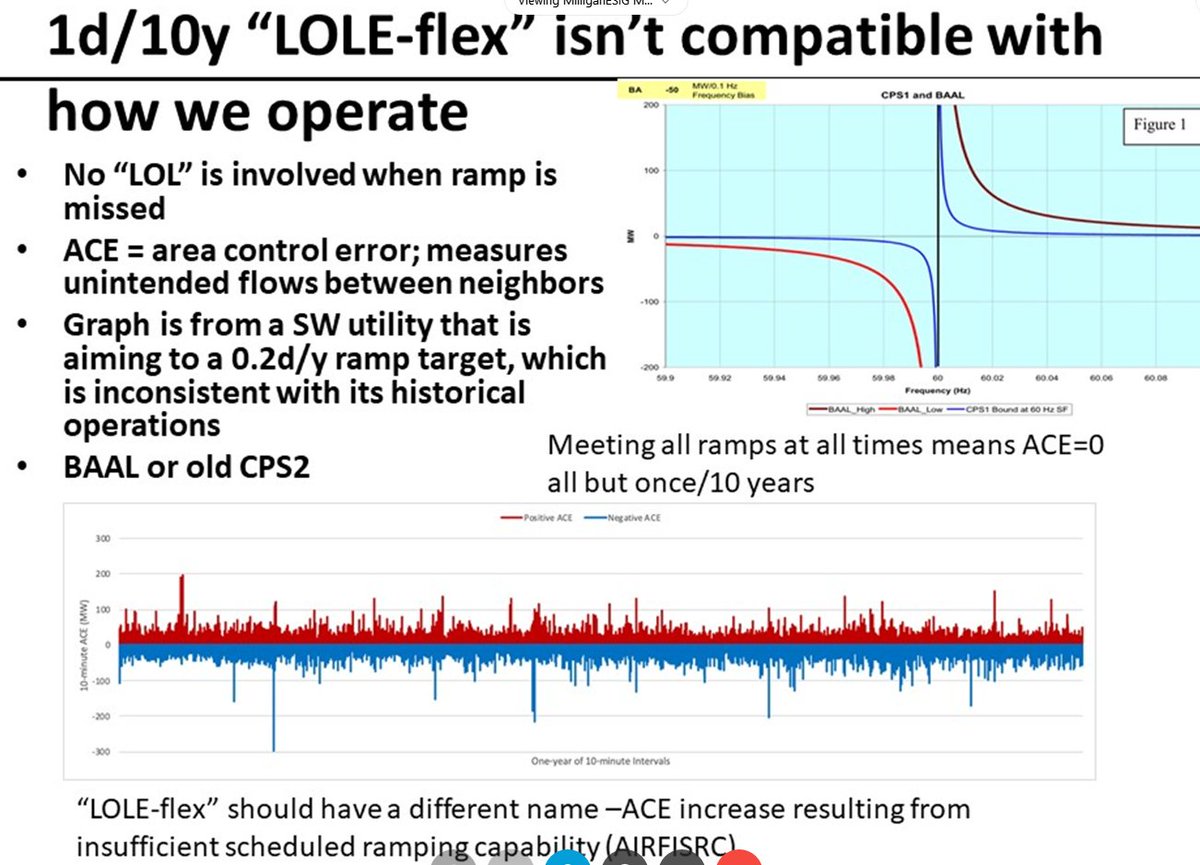
Q: Did we have loss of load events due to insufficient capacity?
A: You could argue that some polar vortex events (or 1/50, 1/100 storm events) has caused this.
Transmission has not enough been incorporated in resource adequacy assessments.
Changes in Capacity Value for Energy Storage and DR with Increasing VG Levels [Keith Parks, Senior Trading Analyst, Xcel Energy]
[2] Keith Parks will present on the upcoming 2030 planning process (Changes in Capacity Value for Energy Storage and DR with Increasing VG Levels)
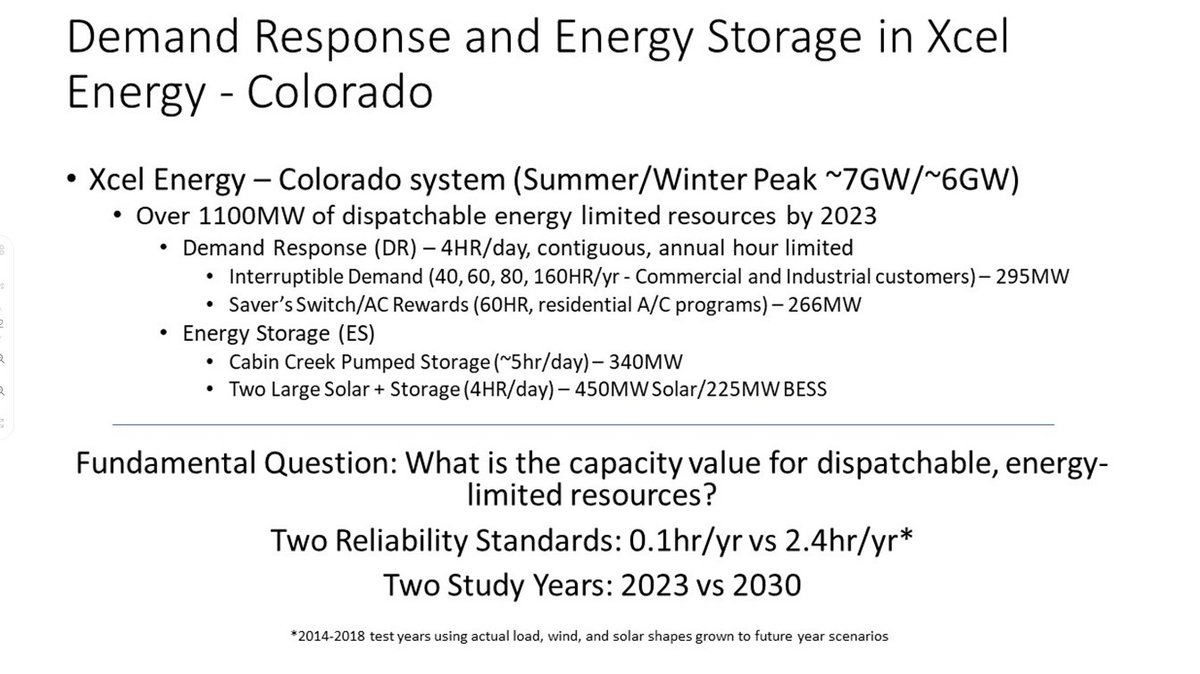
For @XcelEnergyCO in Colorado, which is moving fast towards a highly renewable energy system. https://t.co/WVYjPQGs5D
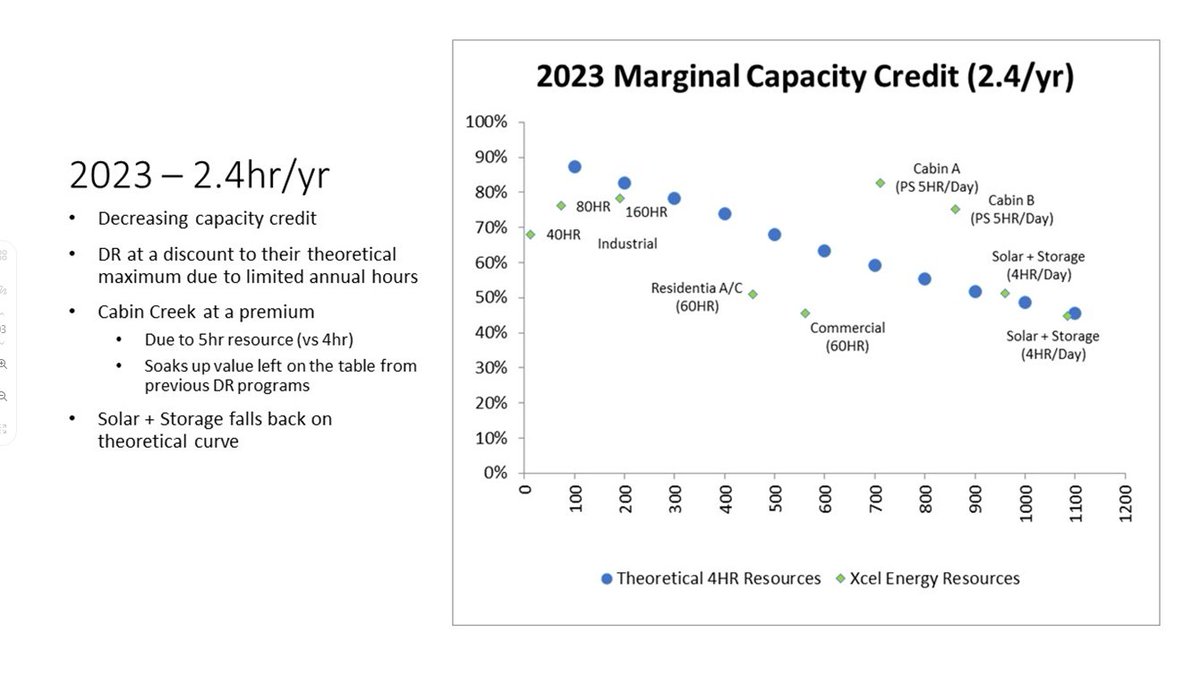
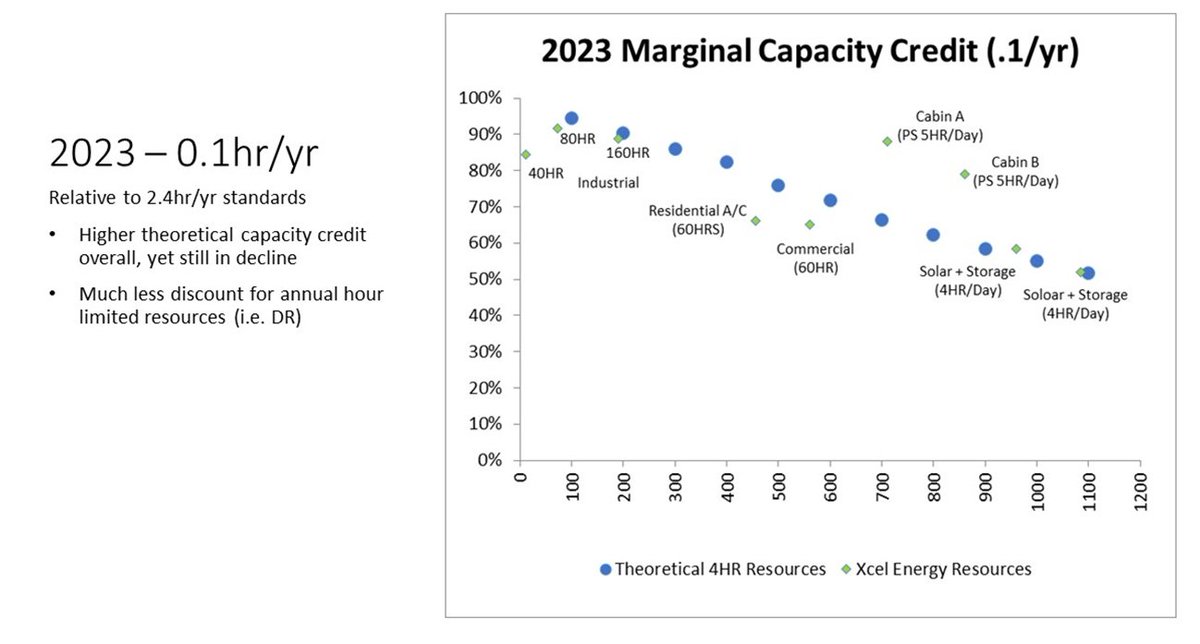
@XcelEnergyCO will have 1100 MW dispatchable energy by 2023, divided in demand response and energy storage
Demand response (industrial): around 295 MW interruptible demand
Demand response (residential): around 266 MW
Storage: pumped (340 MW) & solar (450 MW) https://t.co/GoRzJR5aYD
For theoretical 2.4 hour battery (in 2023): blue points = theoretical maximum
Green squares = real cases
Commercial/residential is below value, because 60-hour storage
Cabin creek is at premium (= 5 hour resource) soaks up value that is left on the table (comm./residential) https://t.co/YYAa6VOoJR
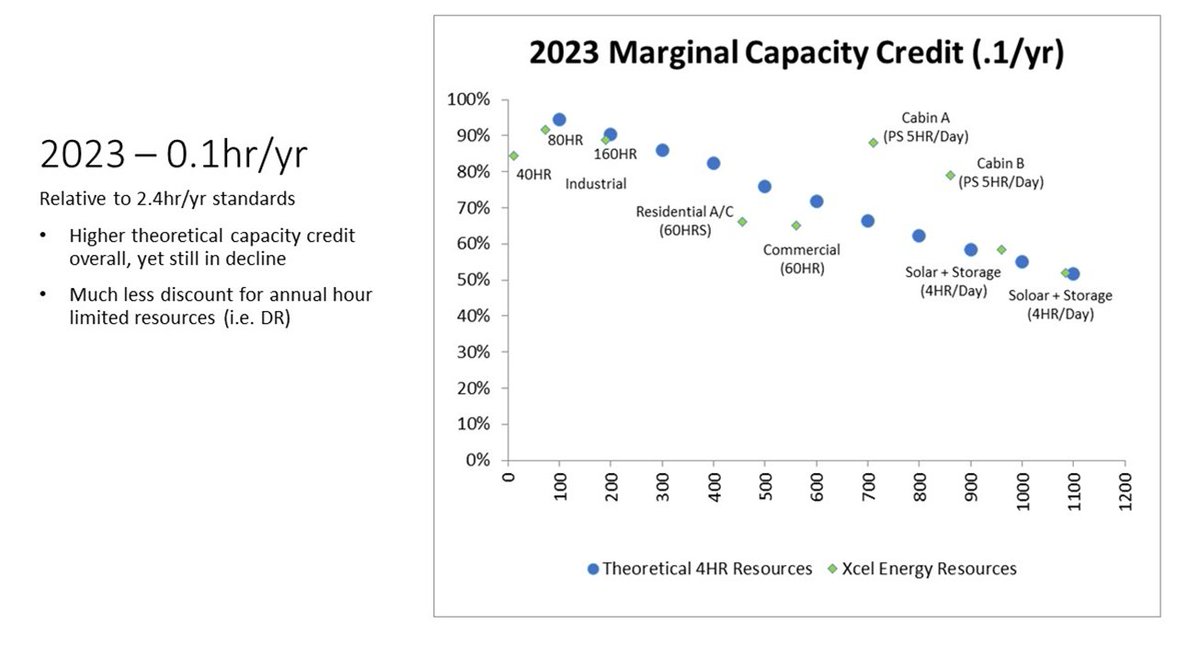
The same year, with a higher reliability standard (0.1 instead of 2.4/year). https://t.co/YdR6peyVax
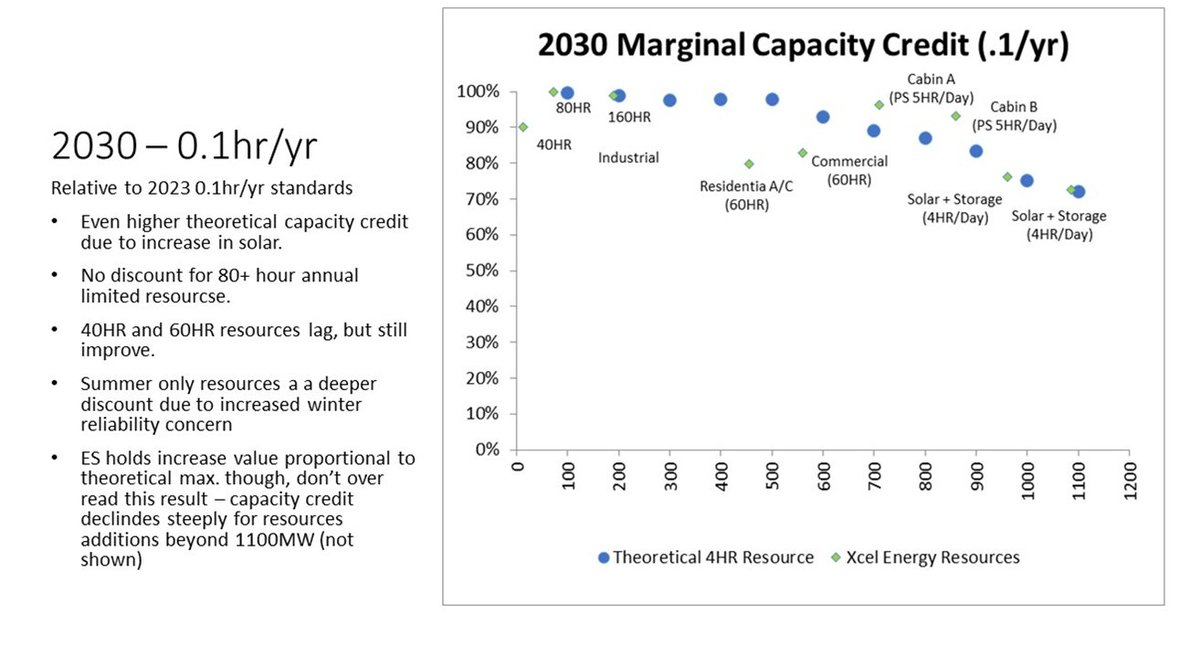
The same marginal capacity credit, in 2030 (more variable solar) https://t.co/a3JN6b9yt9
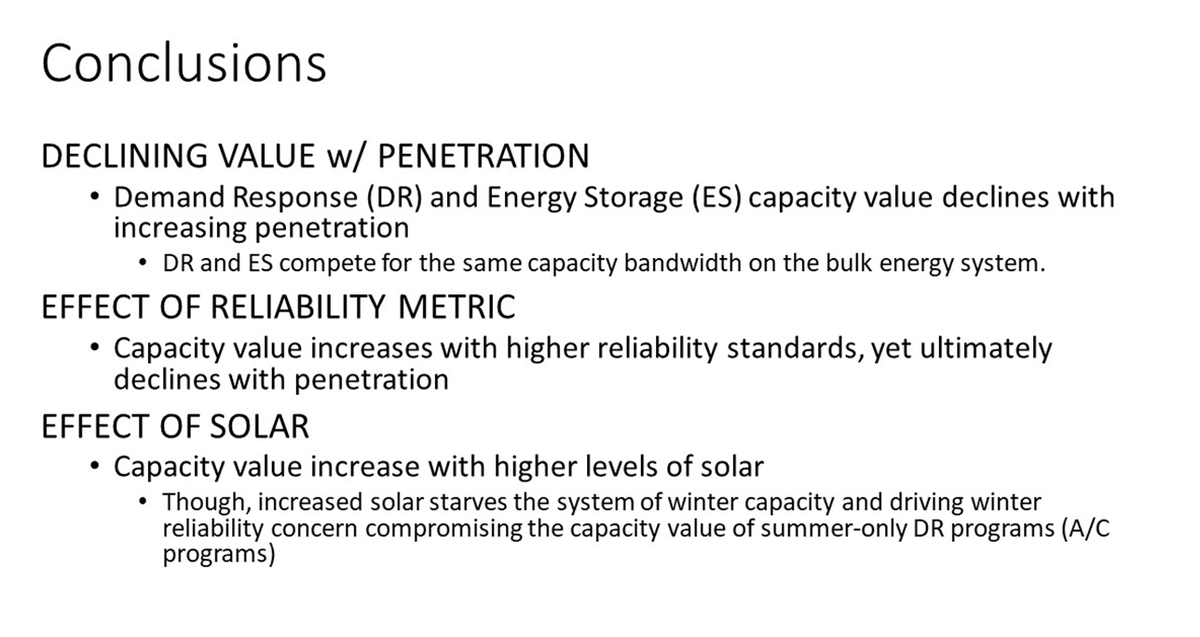
Conclusions:
- Demand response and storage capacity value declines with increasing penetration
- Capacity value increases with higher reliability standards
- Capacity value increases with higher levels of solar (because more variable renewable generation) https://t.co/YmTfDCYpK5
Q: How are resources ordered? (x-axis)
A: They are ordered by MW.
Q: How did you estimate theoretical maximum for 4-hour storage? https://t.co/HibBbzLWsw
Q: How did you estimate theoretical maximum for 4-hour storage?
A: Ran a theoretical (currently non-existing) 4 hour battery energy storage (85 % efficiency) through model, to compare and contrast the other storage/demand response items. As a visual marker.
Q: Where there assumptions made in model on usage of 4 hour storage/demand resources?
A: It is used to minimize the loss of load probability for a specific year with specific solar & wind energy profile, in order to mainting reliability standards (of 0.1, 2.4 hours loss/year).
RA Considerations for Renewable Integration in Japan [Kazuhiko Ogimoto, Project Professor, University of Tokyo, Japan]
[3] Kazuhiko Ogimoto from [https://t.co/VLdPOeP3Gs] will talk on RA Considerations for Renewable Integration in Japan https://t.co/8nOjy2QySK

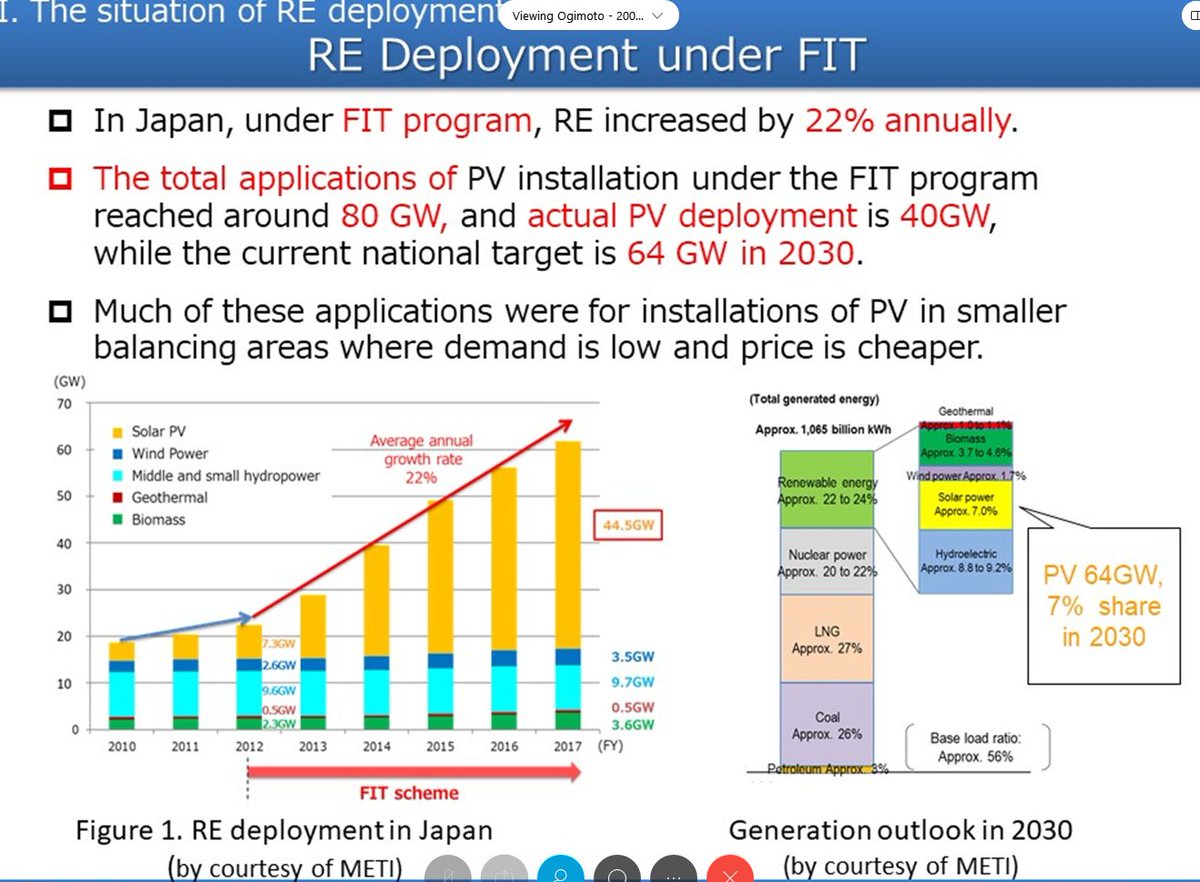
RE increased yearly by 22 % Total PV capacity = 80 GW, 40 GW deployed (nat. target = 64 GW) https://t.co/aRybOBJjNA
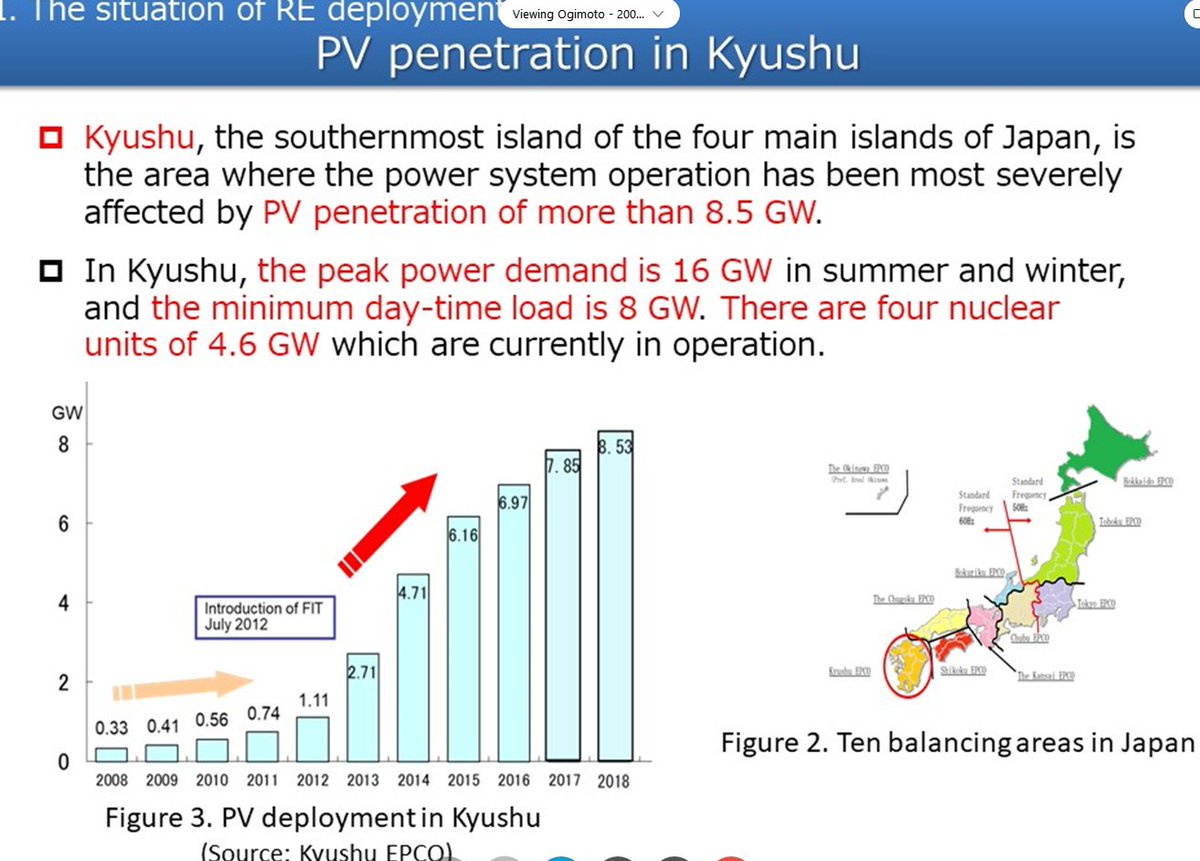
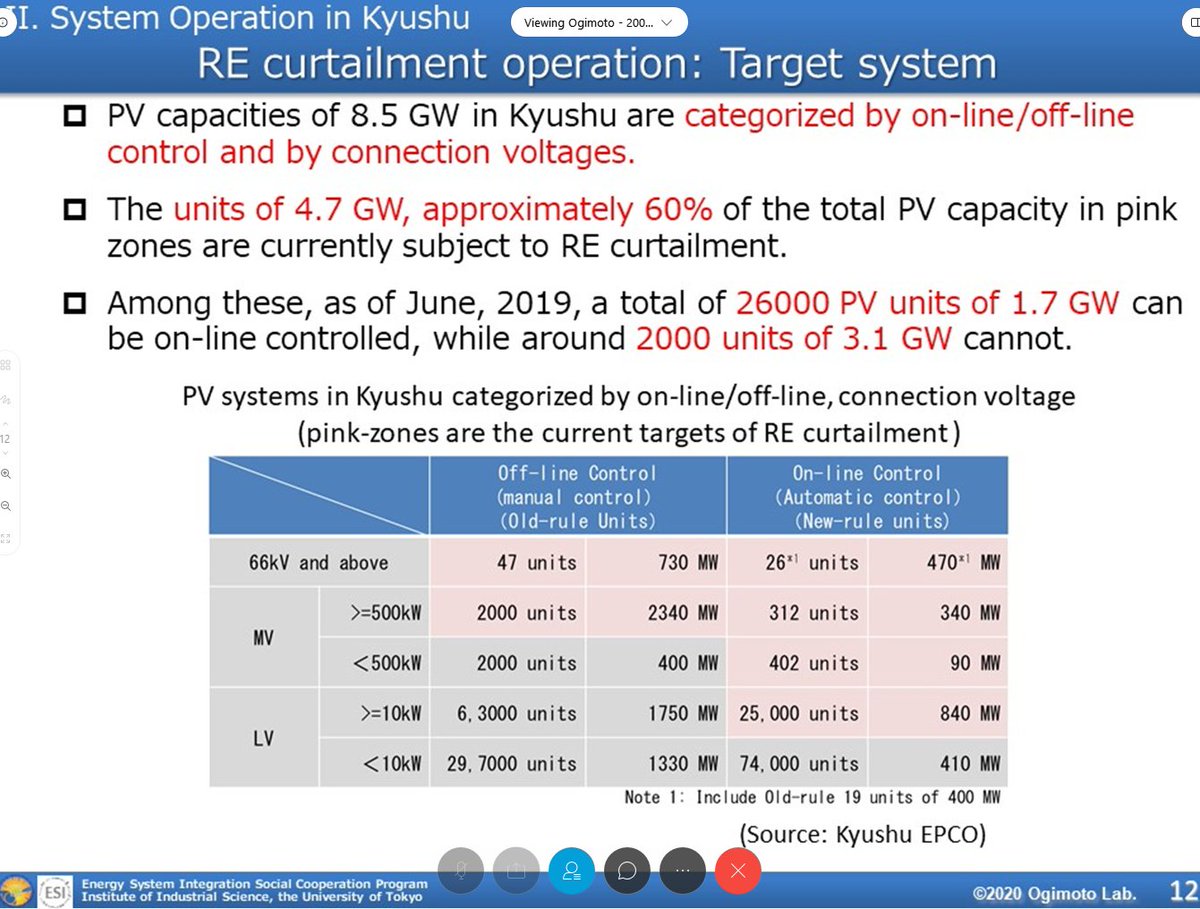
Kyshu island: PV penetration of more than 8.5 GW https://t.co/45JN5GVagG
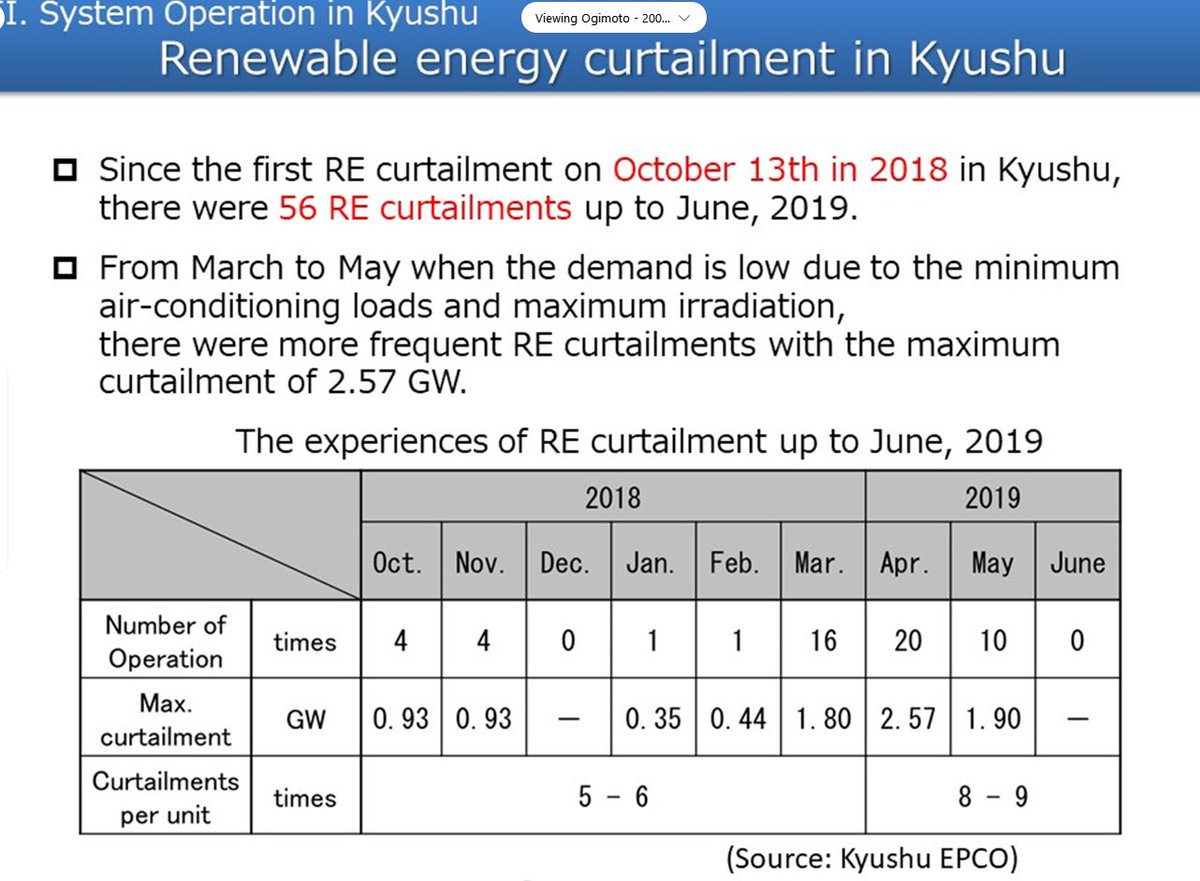
Since october 2018: 56 curtailments of renewable energy (up to june 2019), with a maximum of 2.5 GW https://t.co/qMaCjtjbU2
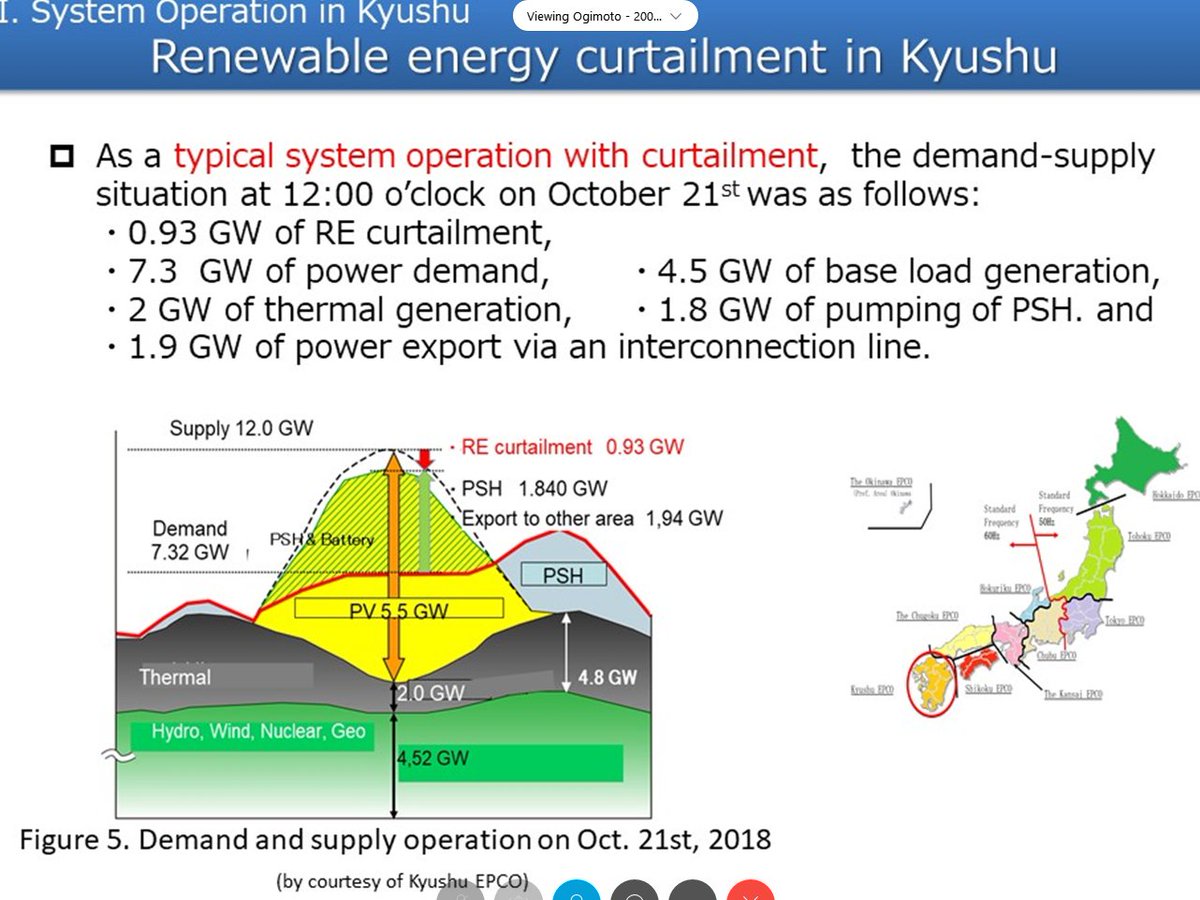
Example of a typical curtailment event: October 21st (2018) https://t.co/cP4L95ZtMg
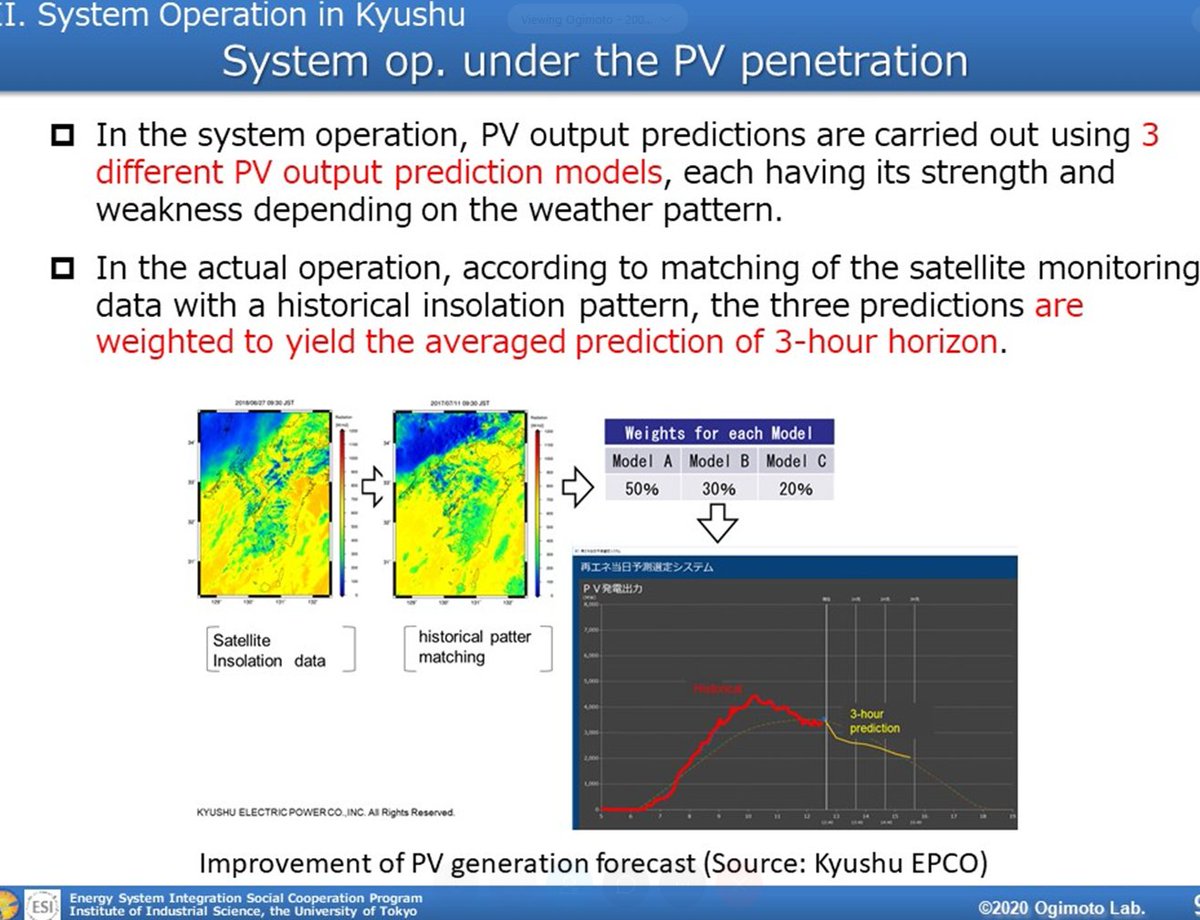
3 different PV production predictions models are used https://t.co/zangKnuGnK
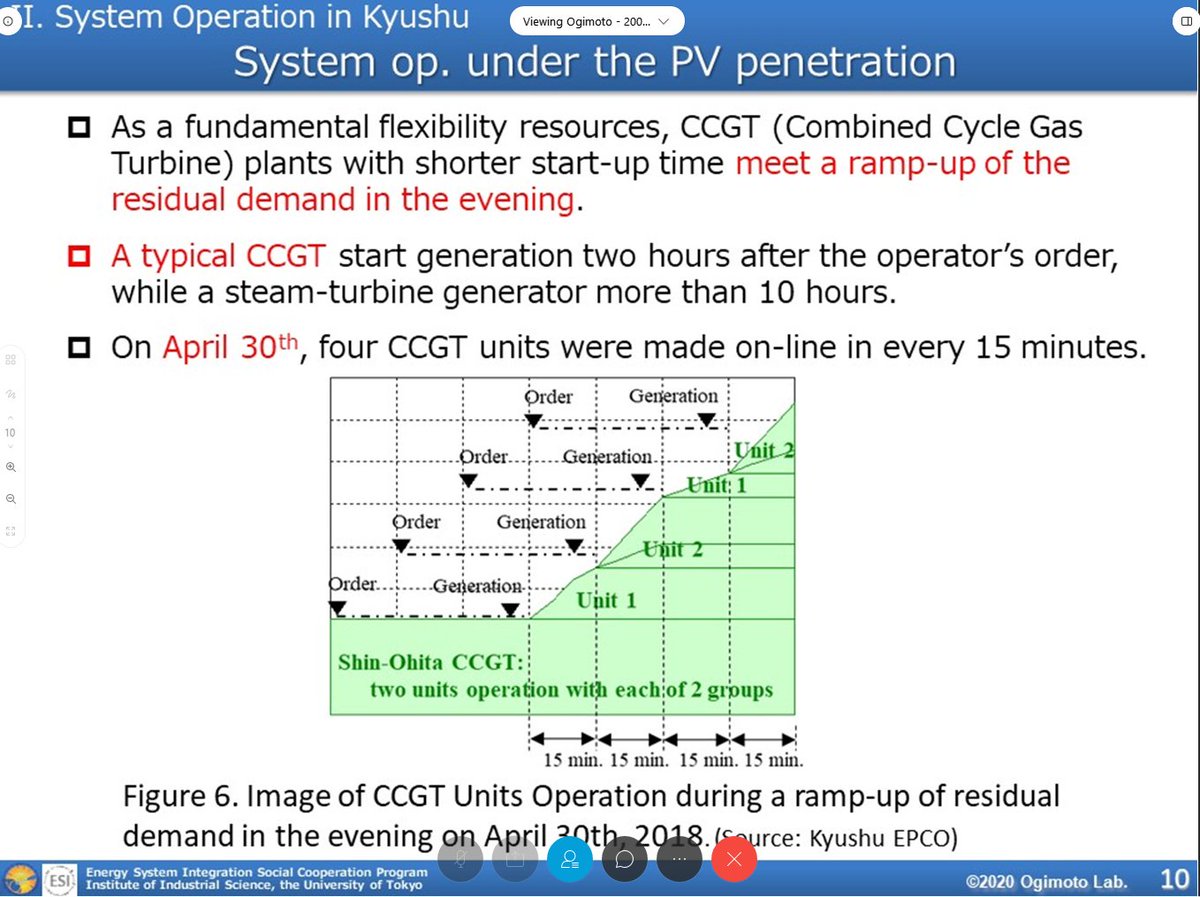
Combined Cycle Gas Turbine plants meet ramp-up of residual demand in the evening https://t.co/98lcSADO1t
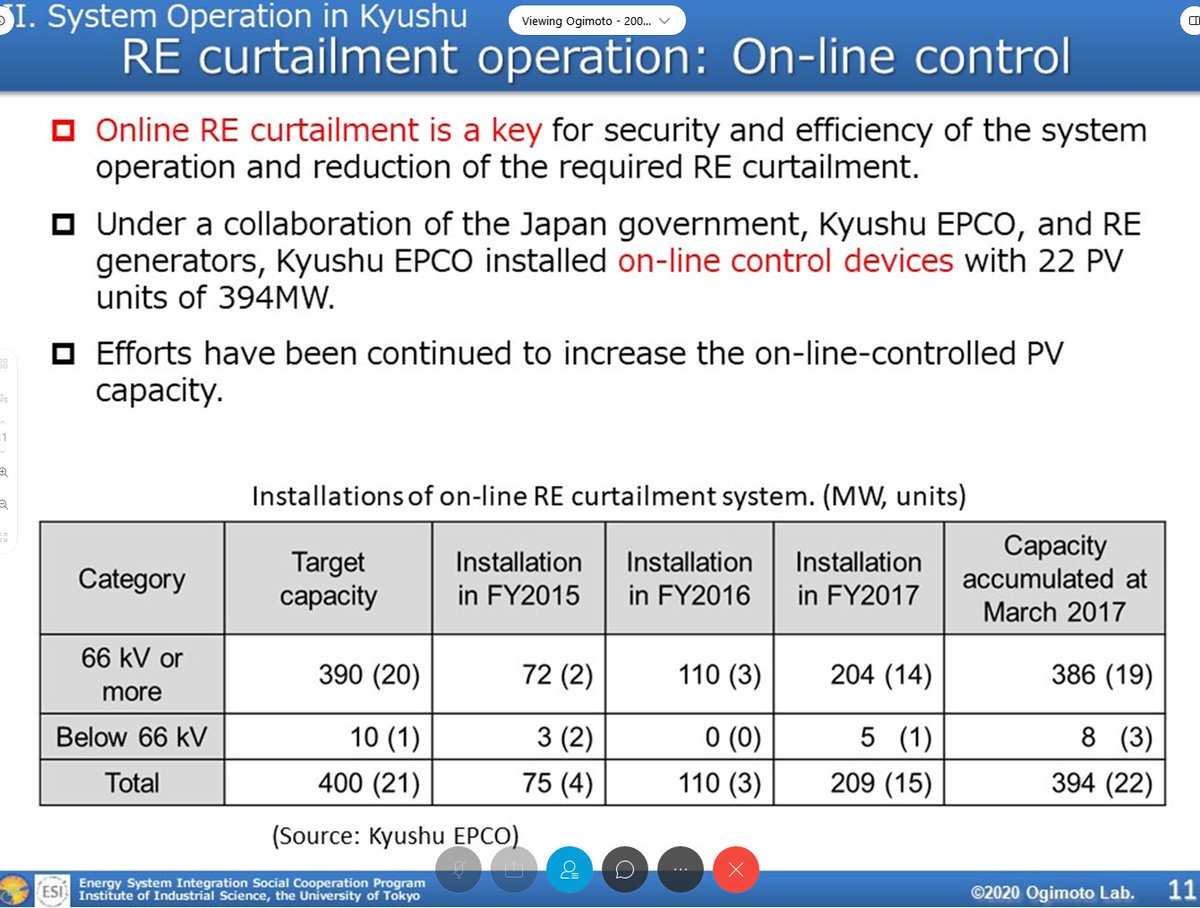
On-line control devices for 22 PV units of 394 MW have been isntalled, efforts to increase this. https://t.co/wo1ydVQACS
Approx. 60 % of PV resources can be curtailed https://t.co/HqKilU0eXI
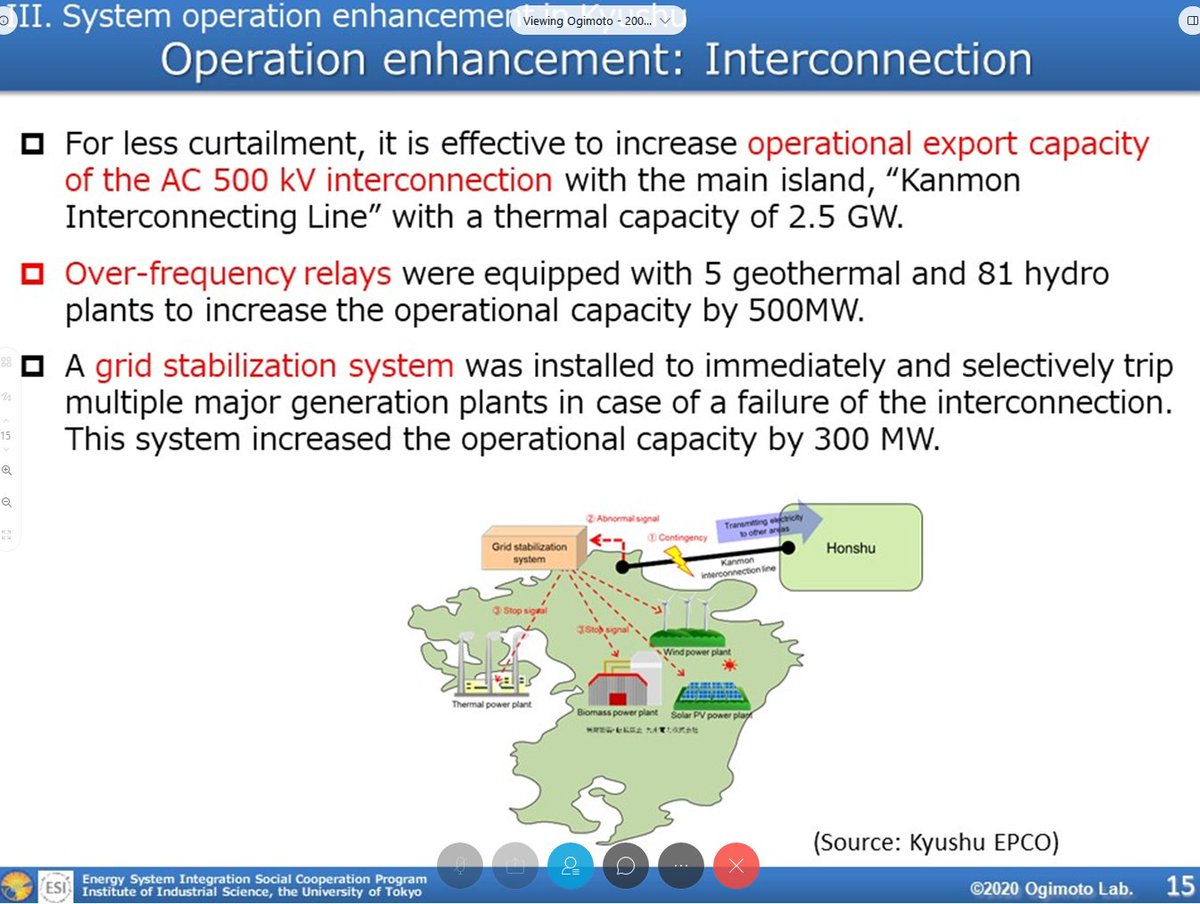
System operation enhancement https://t.co/YT3x6rPaCN
Increased export transmission capacity is effective to reduce curtailment https://t.co/4tK1xHzx1k
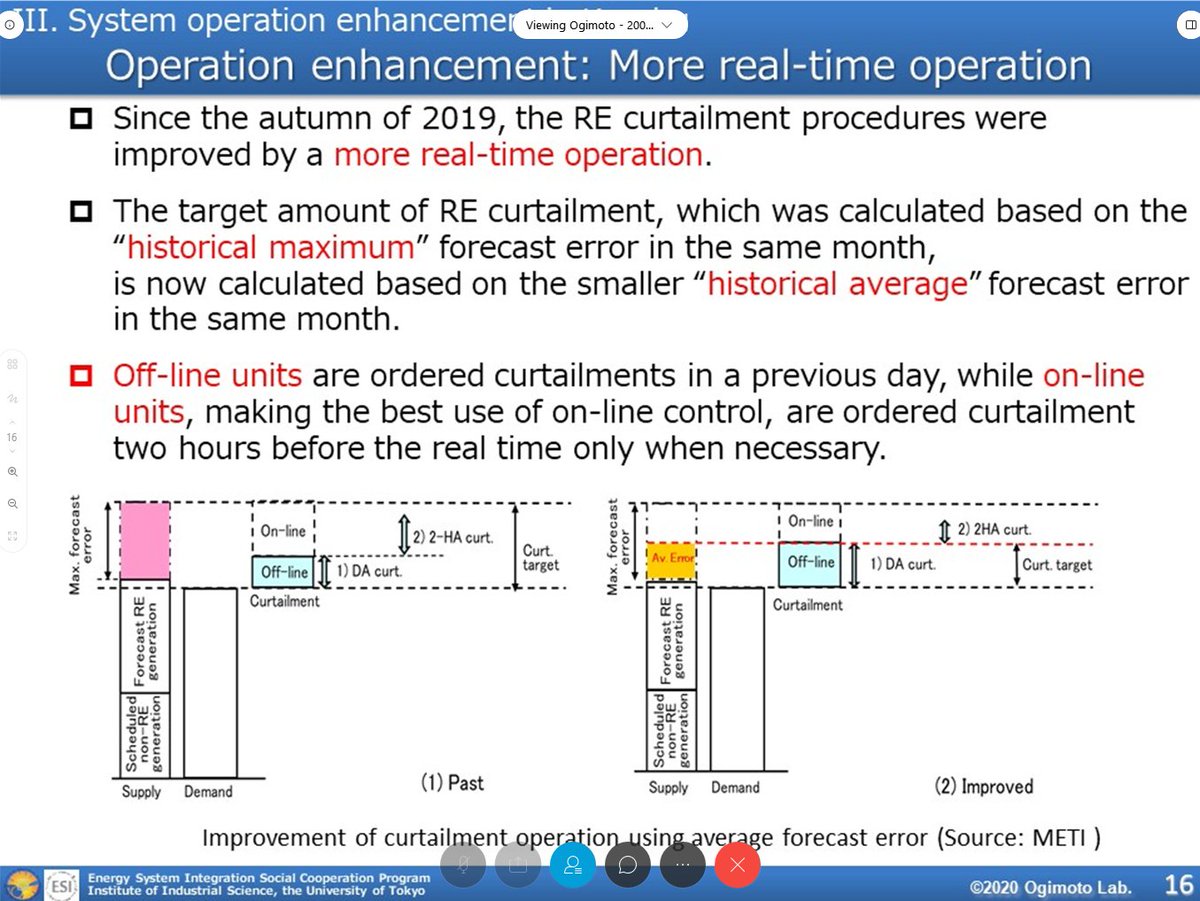
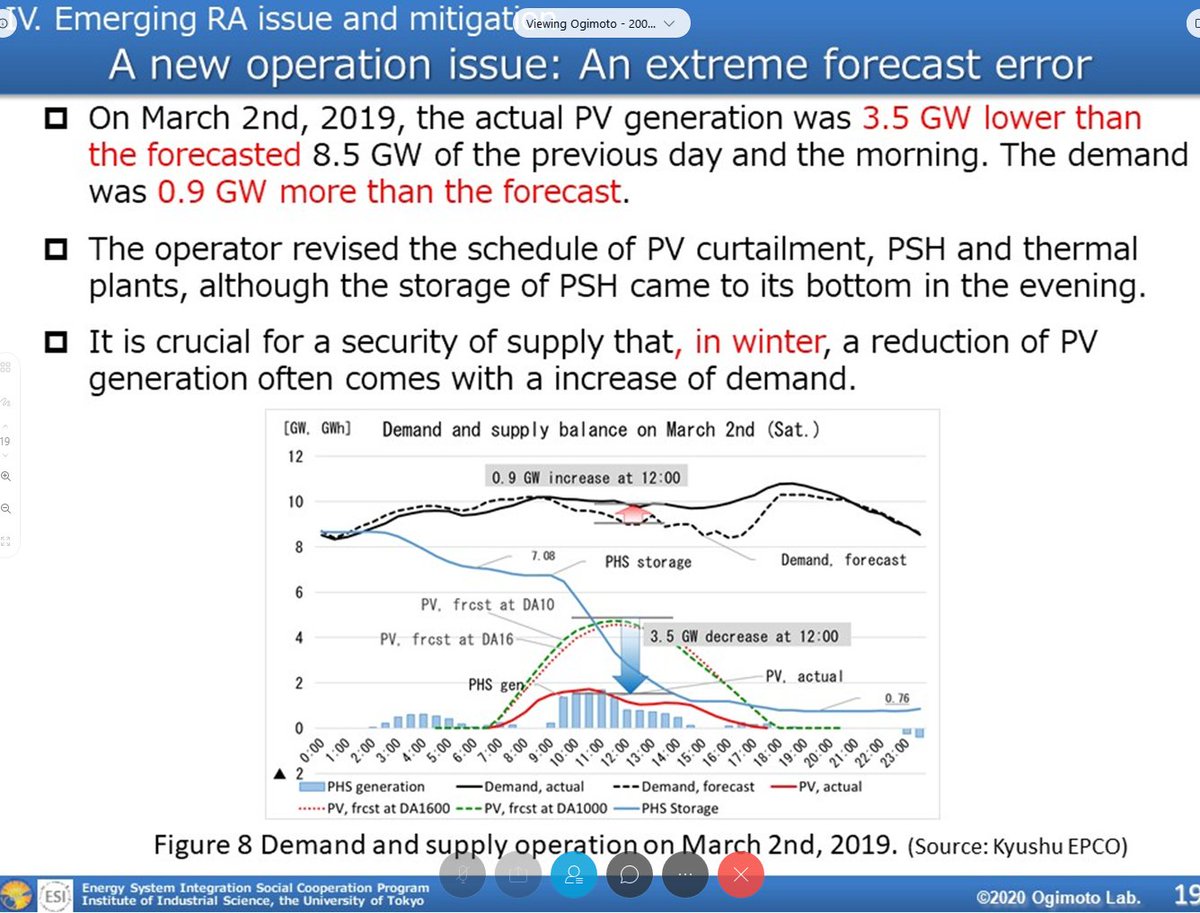
Since 2019, historical maximum forecast error improvement caused a better tailored curtailment management https://t.co/HDSsJ1XFaD
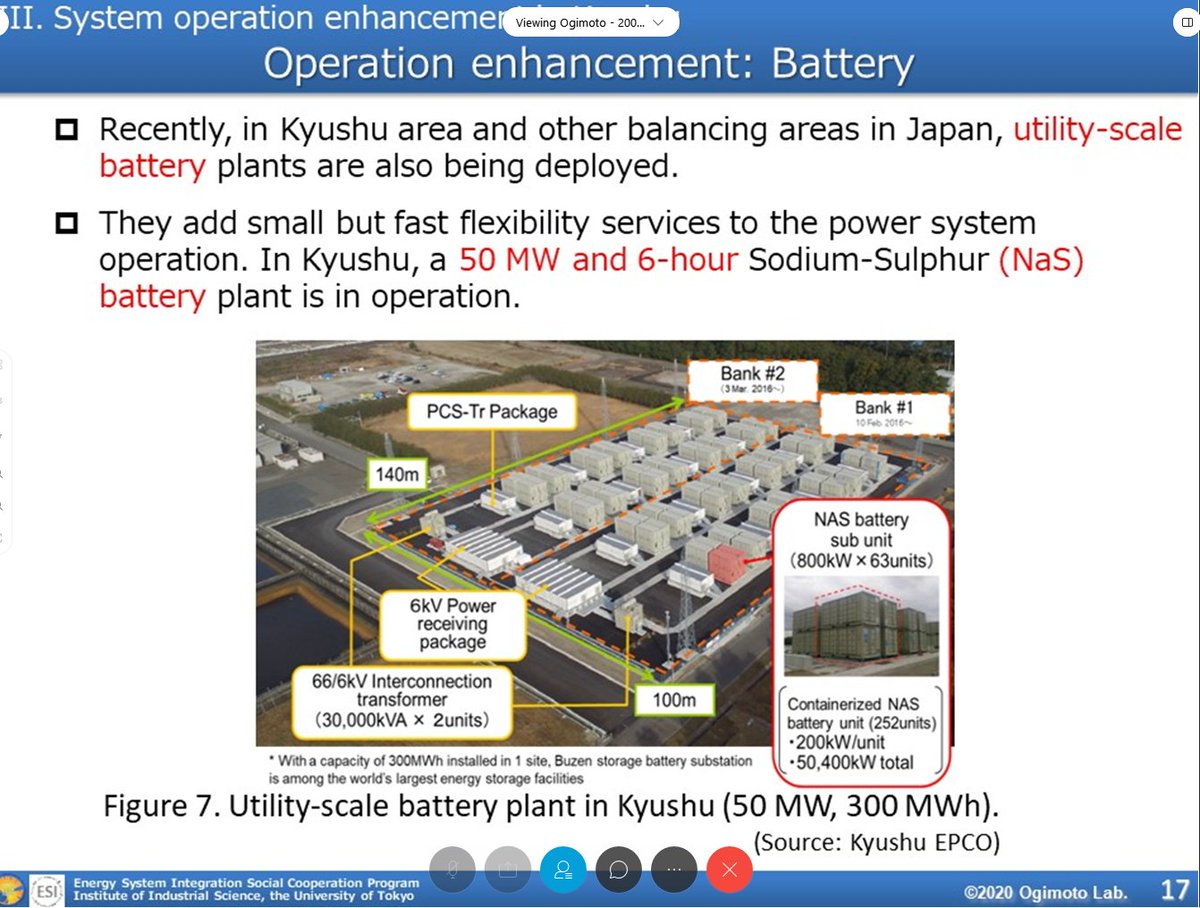
Also battery units are used to reduce curtailment (50 MW plant in Kyushu) https://t.co/VIyIZiswx2
2 March 2019: demand 0.9 MW higher than forecasted. It is crucial for security of supply that reduction of PV, comes with increased demand.
However, this can be managed… https://t.co/rJdxkLeLED
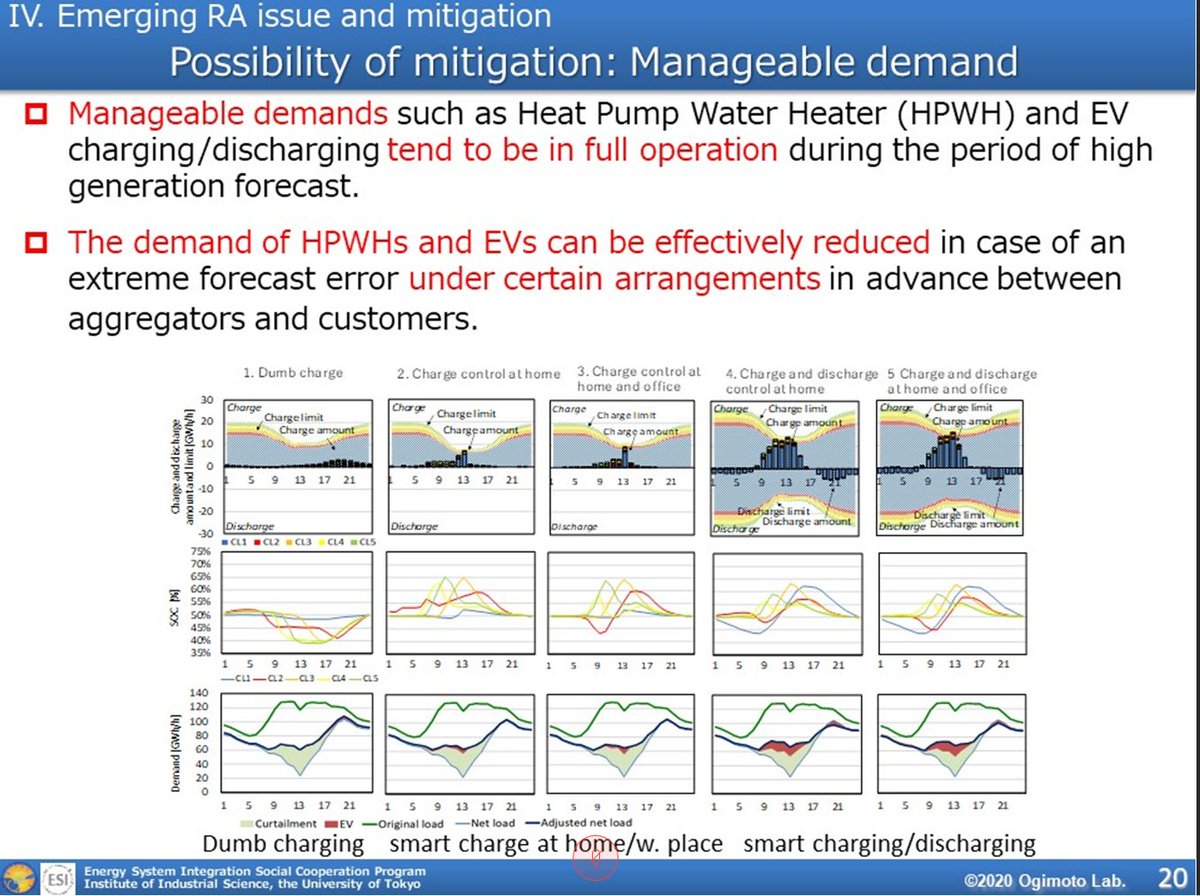
…using heat pumps to reduce demands (in case of extreme forecast errors), using a certain arrangement between aggregators and customers. https://t.co/rNJ1JhXDG5
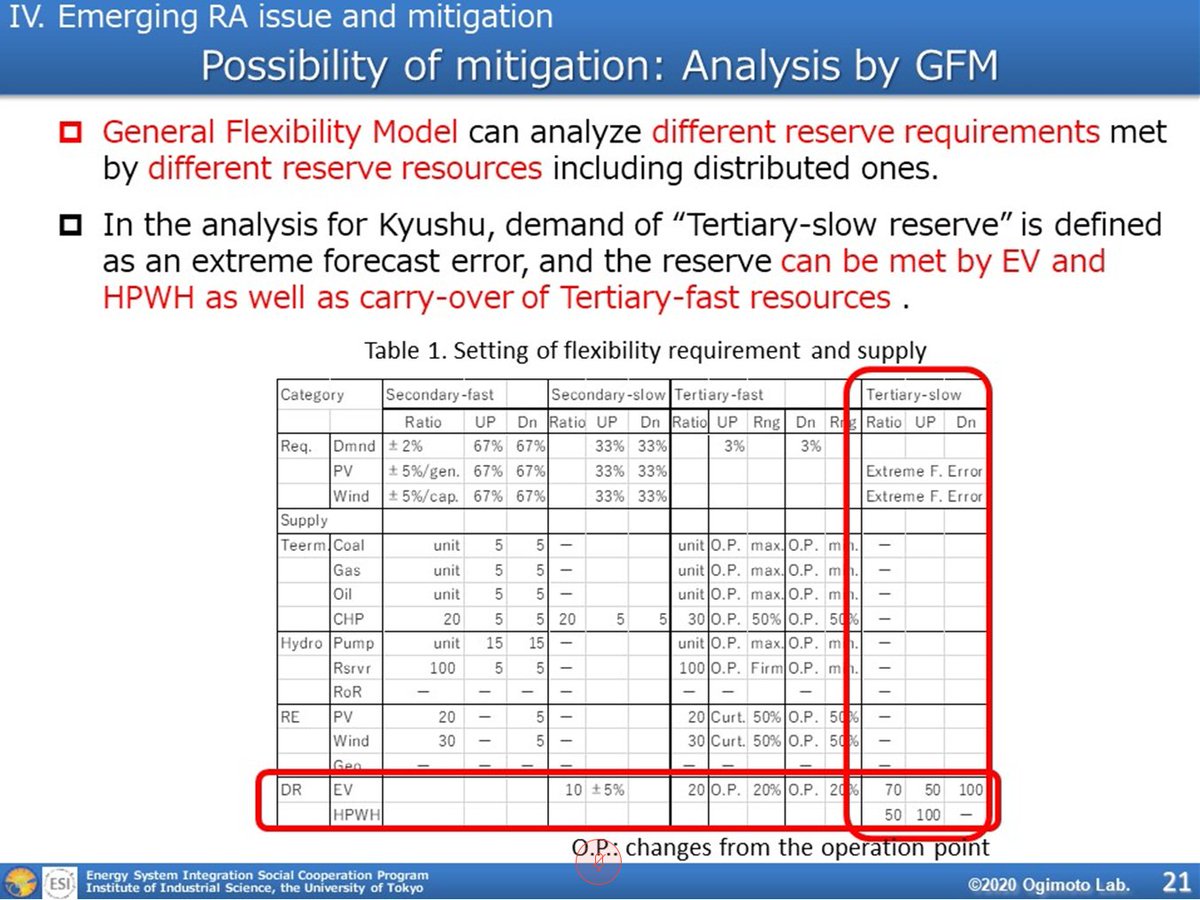
This type of heat-pump mitigation is used with a ‘‘general flexibility model’’
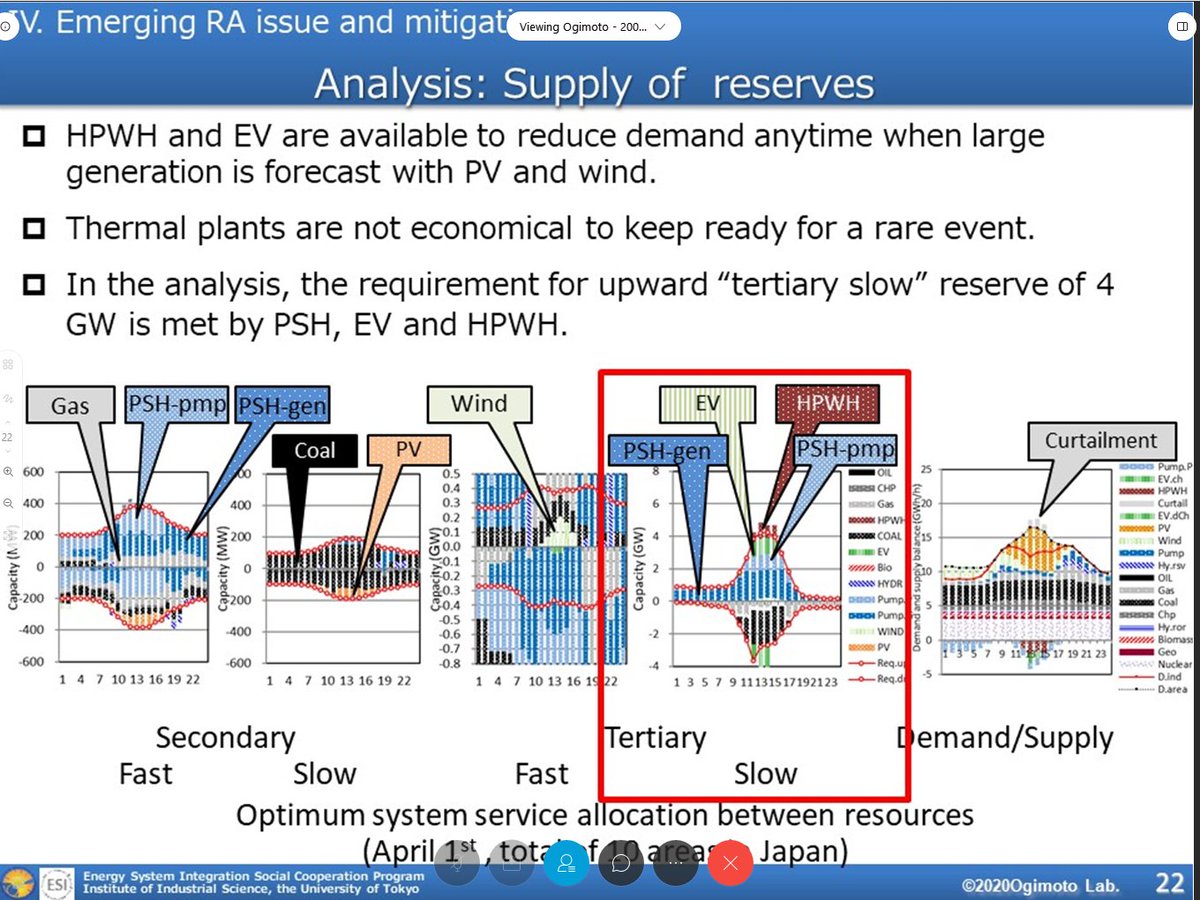
For Kyushu: demand of tertiary-slow reserve is defined as an extreme forecast error –> EV and heat pumps https://t.co/tWkwT2LQ9S
Example analysis of supply : heat pump (HPWH) and EV are available to reduce demand when large generation of PV/wind is forecasted
= fast
Thermal plants = slow, not economical https://t.co/l15mrDplbQ
Conclusions
Extreme forecast errors is an emerging issue in the Kyushu energy grid area.
Heat pumps and EV (batteries) are a possibility to mitigate the extreme forecast errors. https://t.co/8KuaXJxUKq
Closing slide. https://t.co/stPt34JFJt
Q: In the US, there is discussion on how to compensate storage. How is this debate in Japan?
A: Financial compensation? (Q: Yes) They storage facilities are owned by the transmission operators, so no financial compensation is happening or planned.
Securing RA in a VG World [Matthias Fripp, Associate Professor, University of Hawaii]
[4] @MatthiasFripp on Generation Adequacy with Variable Generation (Securing RA in a VG World). https://t.co/XOWALq2r9L
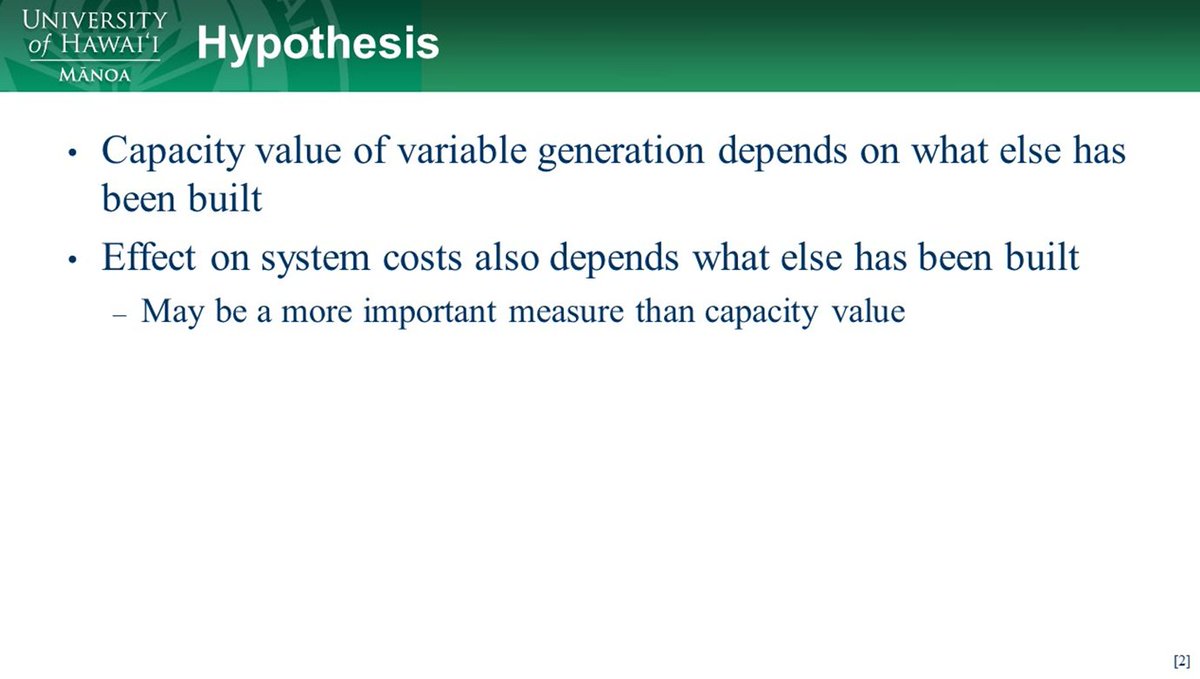
Hypothesis of talk: capacity value/credit assigned to variable generation is not a stable number, and is therefore not useful for planning.
Effect on system cost also depends on what else has been built -> system cost may be more important measure than capacity value https://t.co/oOfy9mNrt7
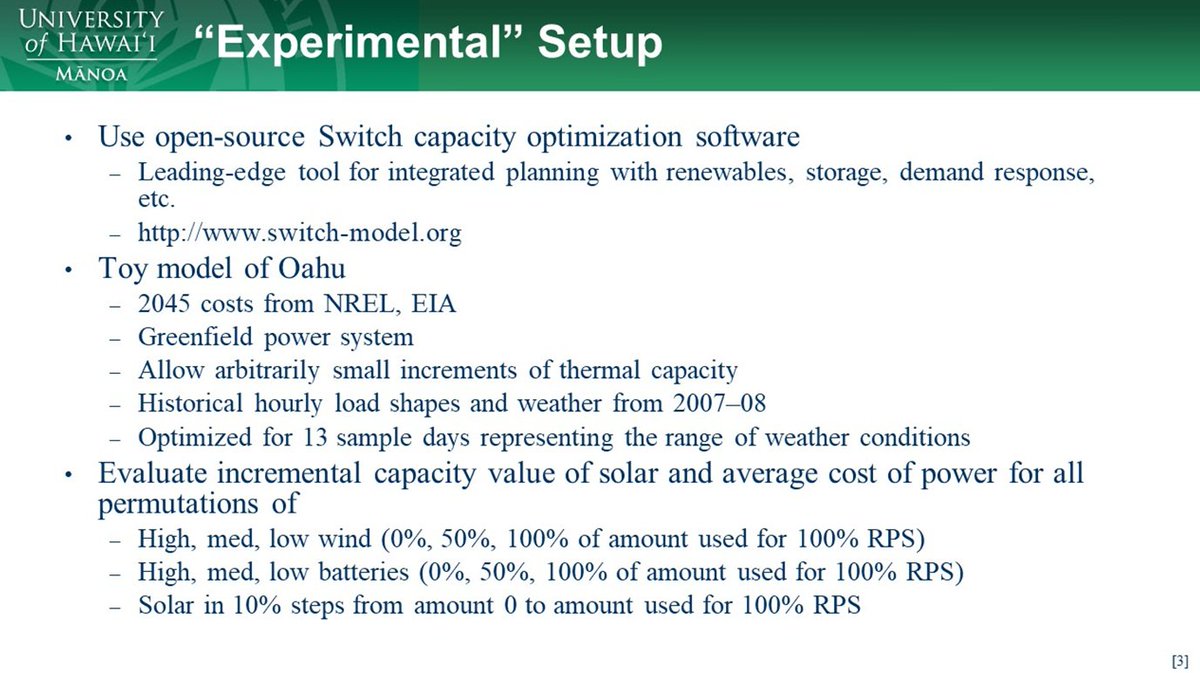
Case study with the open source switch capacity optimization software https://t.co/D1nsqhmxx1 (cc @openmod @nworbmot) of Hawaian Oahu system.
- 2045 costs (NREL, EIA)
- Allow incremental thermal capacity to complement renewables
- Projection of historical data (13 sample days) https://t.co/uAz0ASeId4

Question addressed: incremental capacity value of solar/average cost of power for increasingly renewable energy systems (up to 100 %) https://t.co/4Dg6xrsTup
Results:
100 % renewable systems are energy-limited rather than capacity limited -> management of most difficult days (november/december: low wind/sun).
There might be enough storage (batteries), but not enough RE generation (filled up with thermal capacity). https://t.co/wJ0T3jcycV
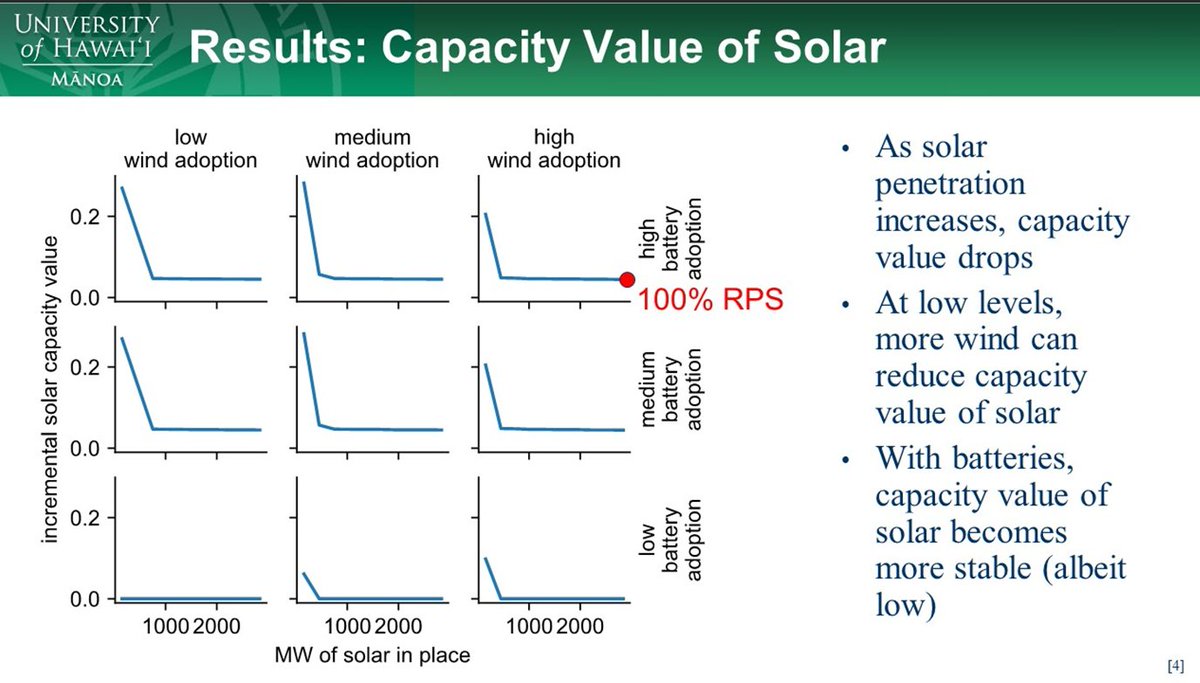
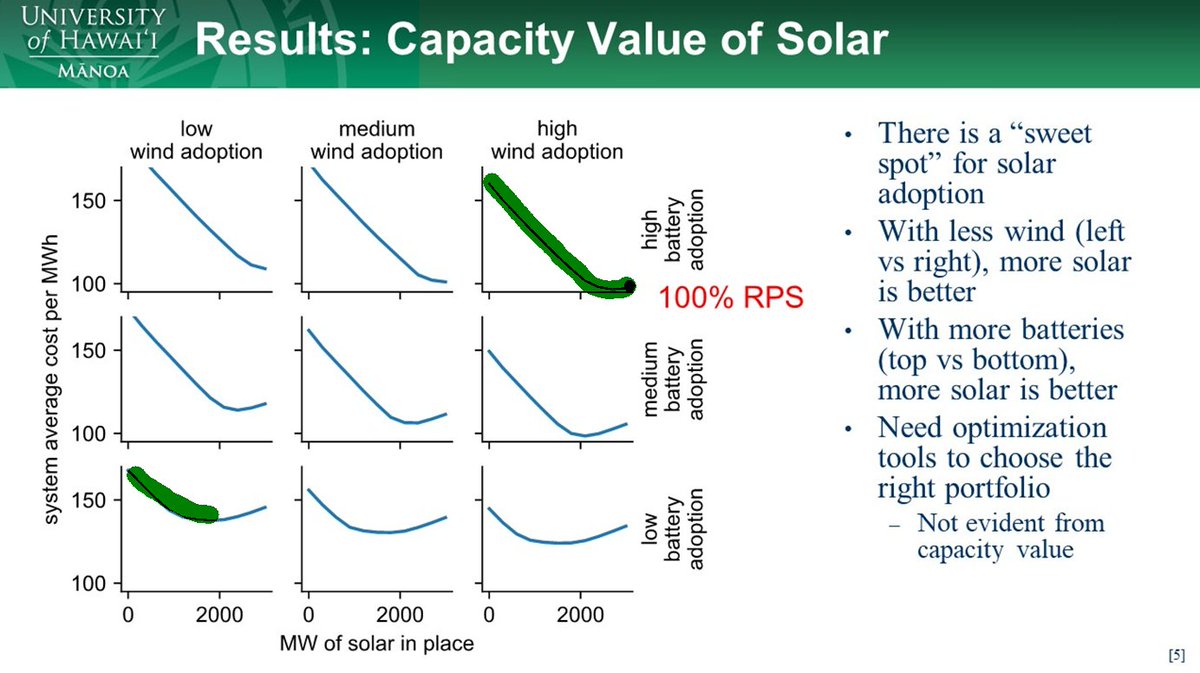
…graphs don’t tell anything about how much wind and solar need to be built.
so..
…it is more useful to look at the average cost of power production.
(two extremes: low and high wind/battery).
Room for more advanced capacity planning in integrated resource planning process. This has been done in Hawai. https://t.co/6CdybN8R9c
Conclusions https://t.co/zWpxdGb8FC

Q: What was the duration of the batteries in the analysis?
A: Bulk storage batteries with 6 hour storage.
Resource Adequacy and Markets [Rob Gramlich, President, Grid Strategies]
[5] @RobGramlichDC on resource adequacy and markets.
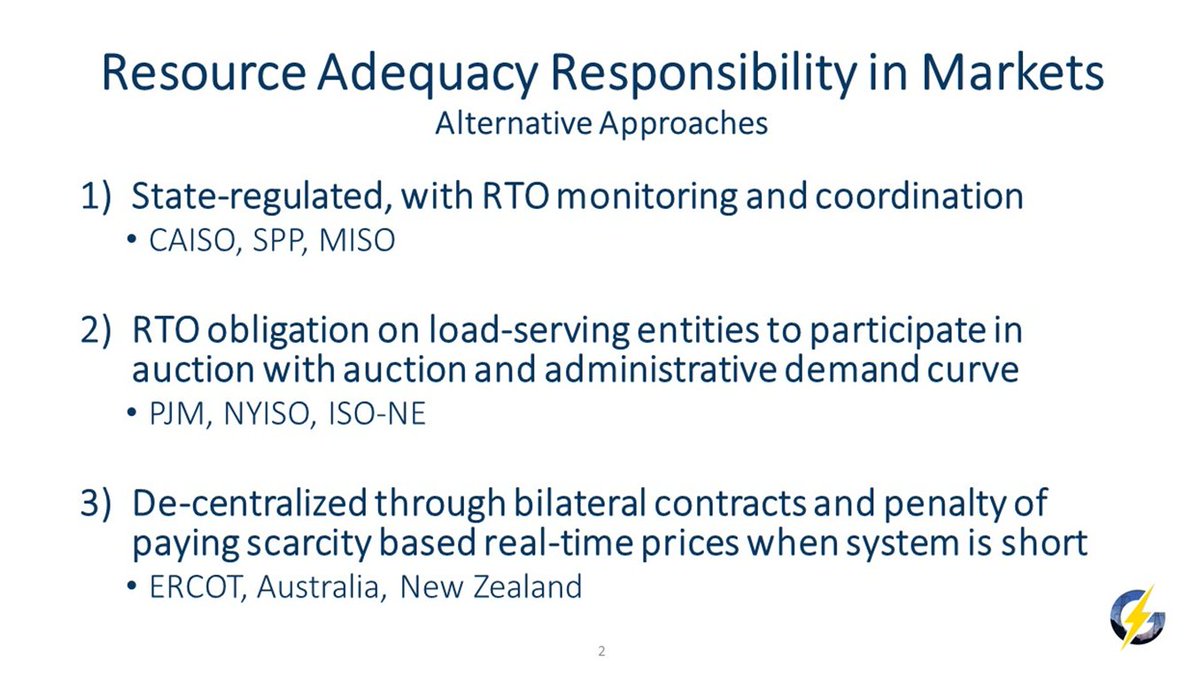
Different options:
-
Traditional: vertically integrated market with regulator (with wholesale and sometimes retail markets).
-
Capacity need is determined
-
Decentralised market through bilaterial contracts (talk focus) https://t.co/KW6R3wCkN9
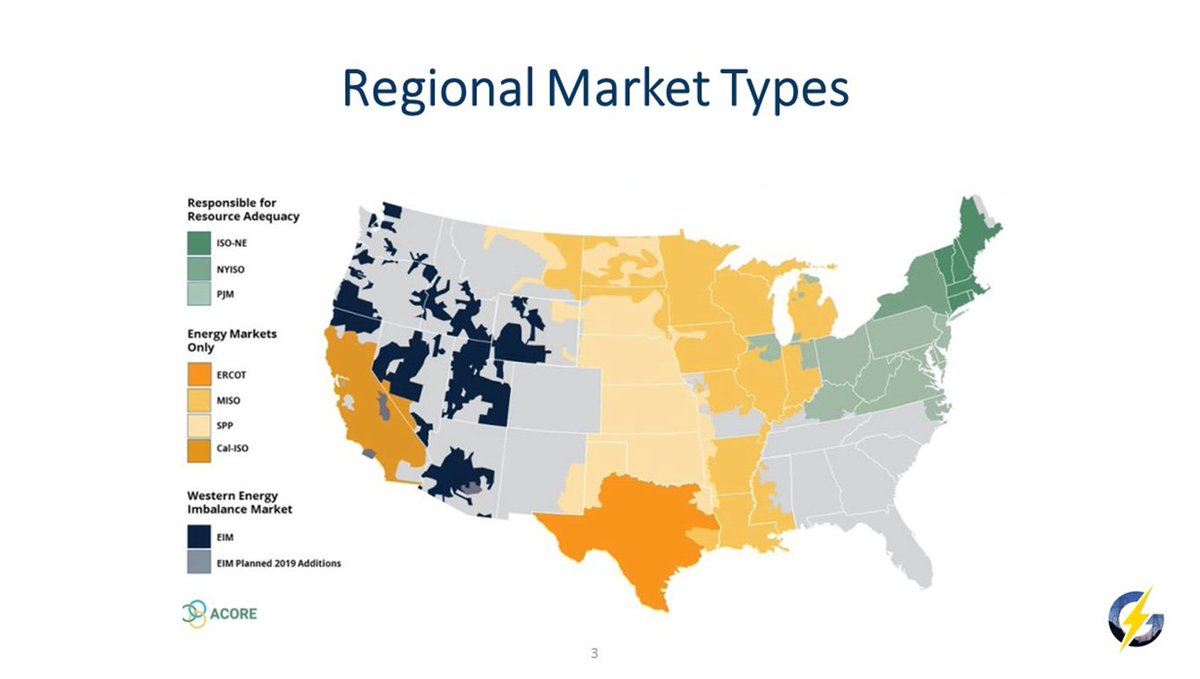
Market types (resource adequacy regimes) in the US:
- Grey: traditional vertically integrated (1) https://t.co/m5BL2OD597
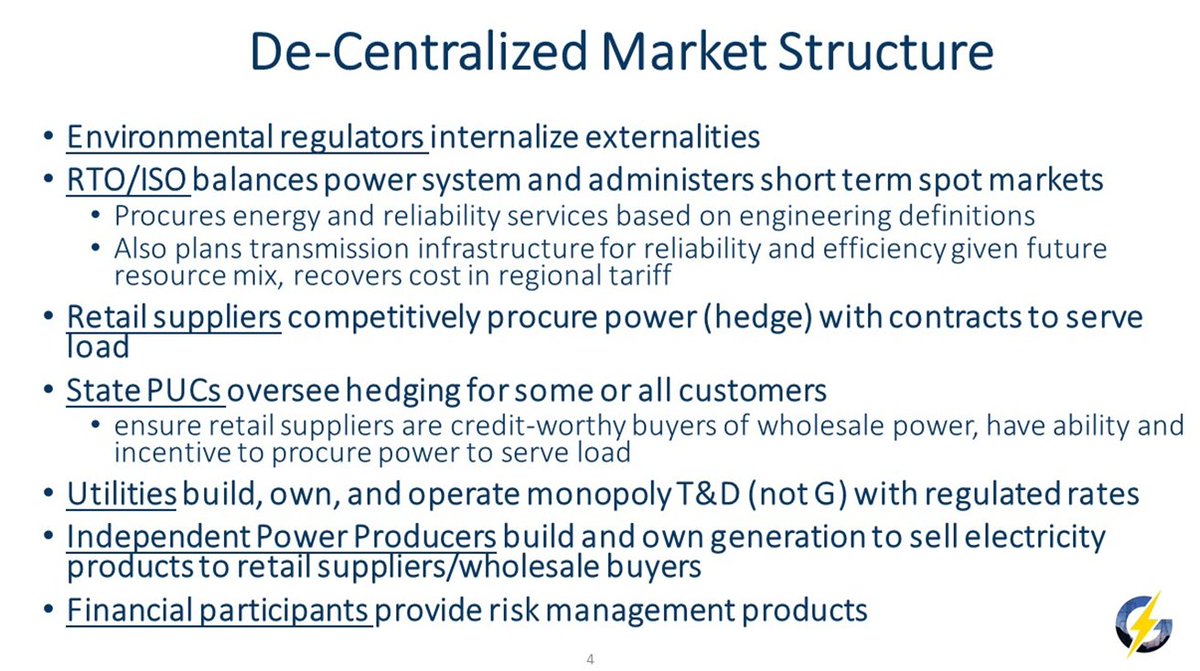
How could a decentralized market look like? (like it exists in Texas)
Retail suppliers = entities responsible for procuring power on long-term basis.
State regulator = making sure the suppliers have the incentive to supply power in long-term (credit worthy, …) https://t.co/VwzzLS5O4J
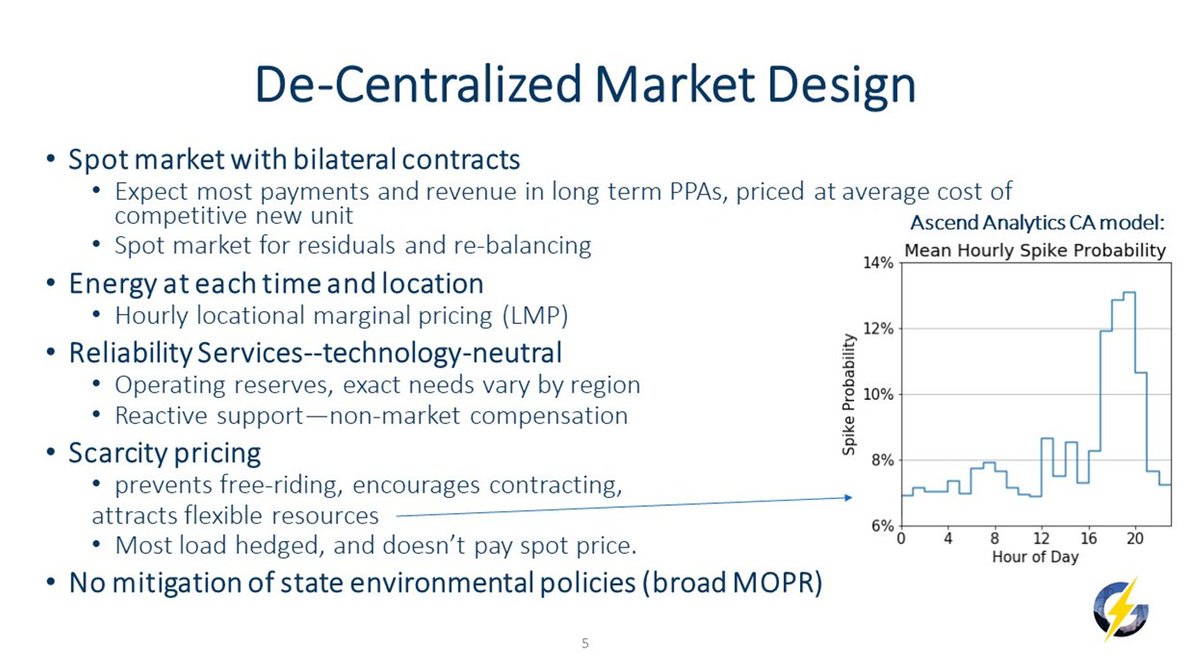
Market design: spot market that allows bilateral contracts to operate behind the scenes. Spot market is for residual balancing. https://t.co/6ocFigUZYC
Is this decentralized market system working ?
In hot summer (2019): supply shortage, price rise, new entries in the system. https://t.co/CevDKVqbbO
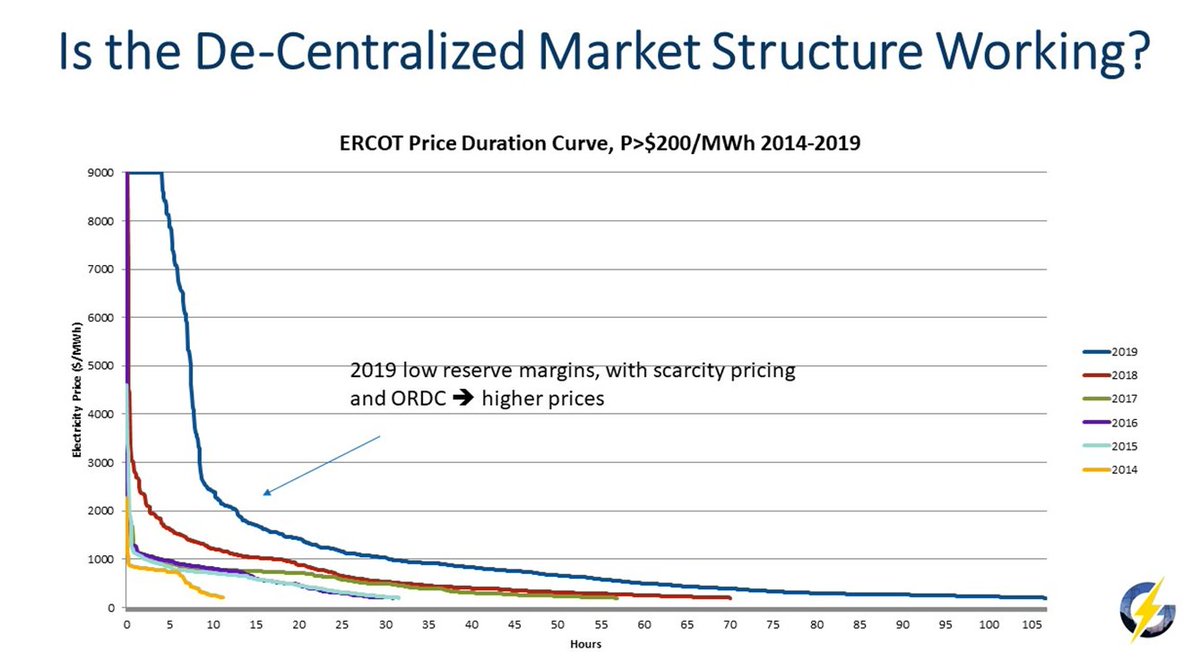
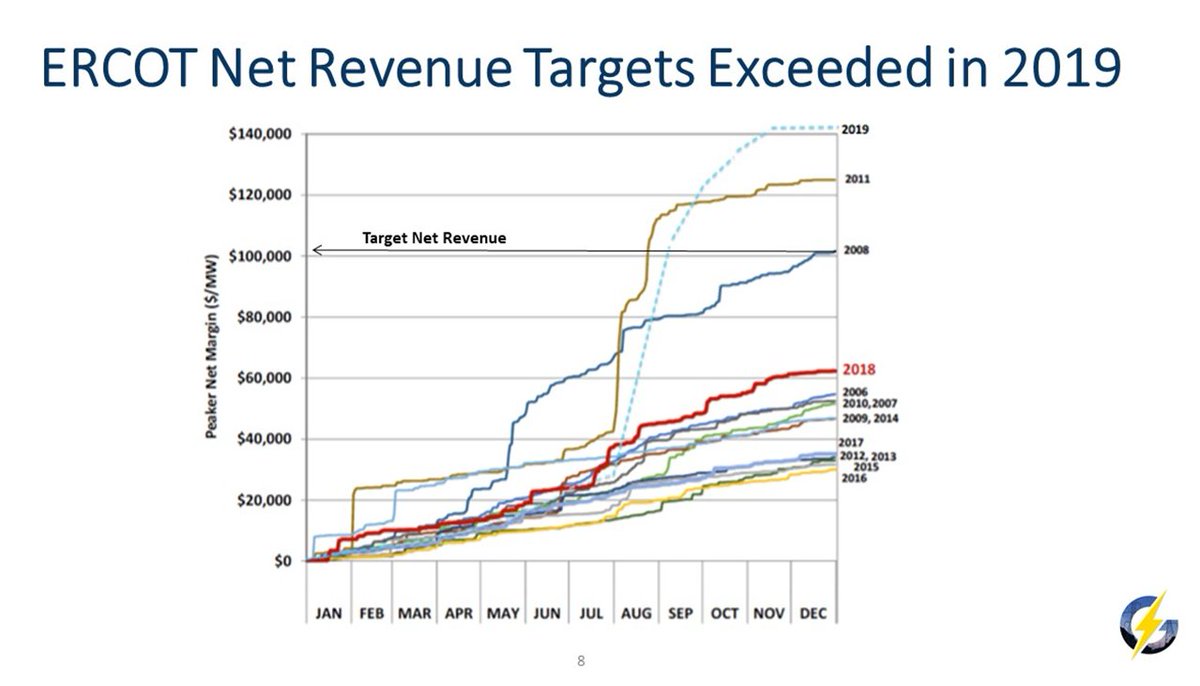
Answer: yes, summer of 2019 was strong signal for new operators to come in. https://t.co/dBUIBc2fWJ
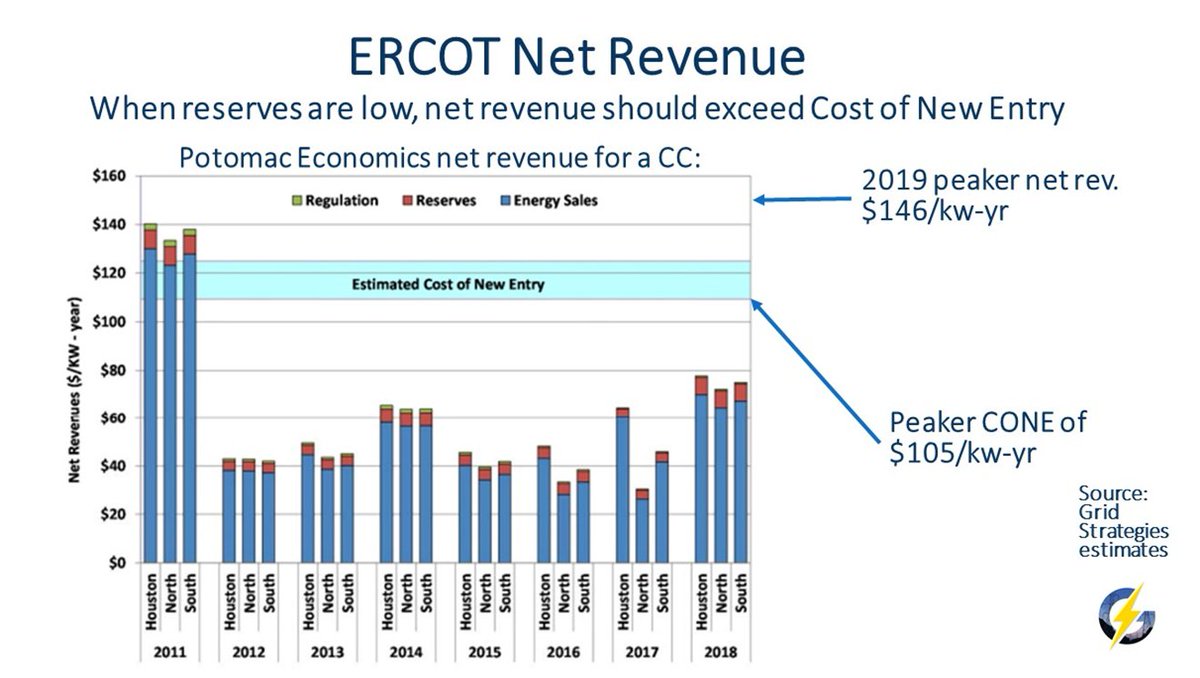
Revenue gained above operation costs https://t.co/ArnCUKSUY1
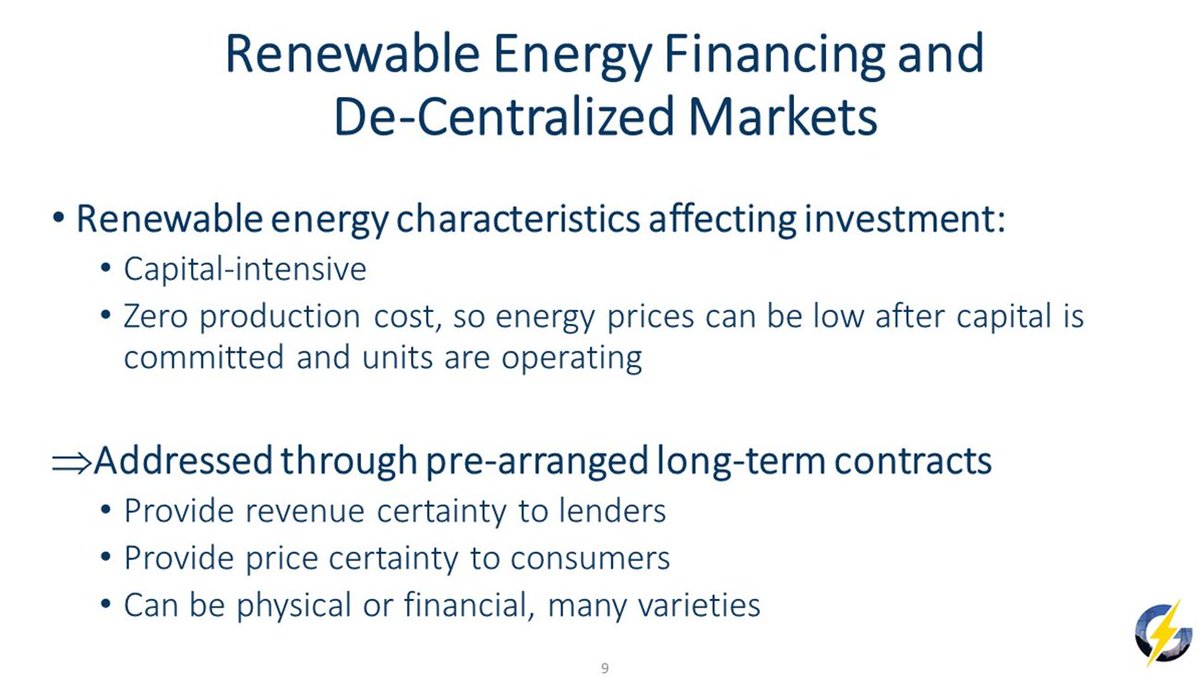
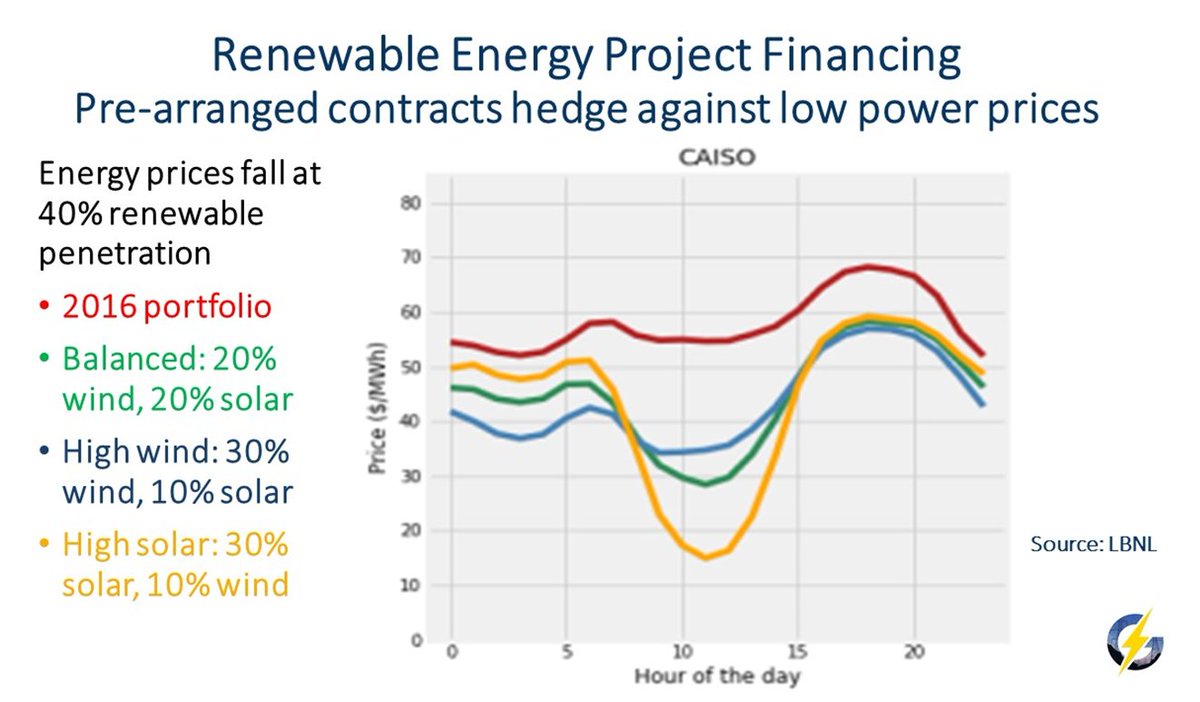
Renewable energy is highly capital intensive, so how to evolve to highly renewable system?
-> Long-term contracts (physical/financial, variety of those). https://t.co/TqmTvb43t7
Example: highly renewable system price cost structure. https://t.co/yHgu7jARen
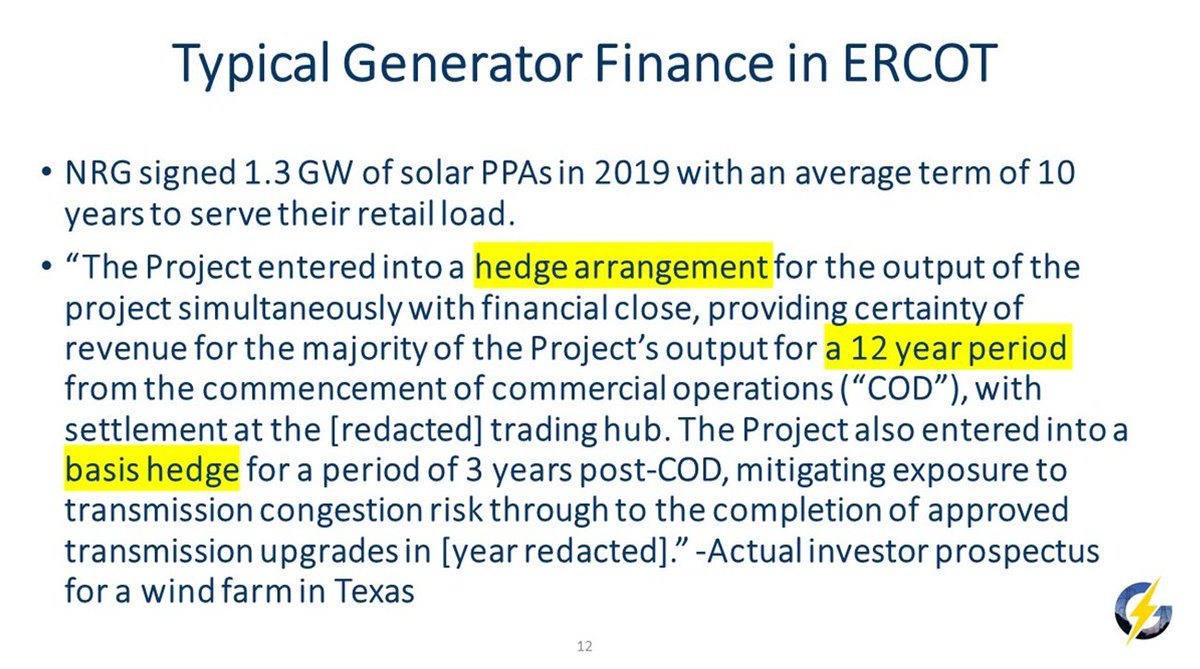
Pre-arranged contracts can do the job. For example: NRG contract in Texas (1.3 GW solar PPA with average term of 10 years to serve retail load) https://t.co/KiyFBMm72E
Q: What effect do renewable buyers (like @Facebook ) have on the market?
Some companies only search for credits, and not necessarily try to match their real-time consumption to 100 % renewables (@tmrowco CO2 signal @corradio @martincollignon @electricityMap)